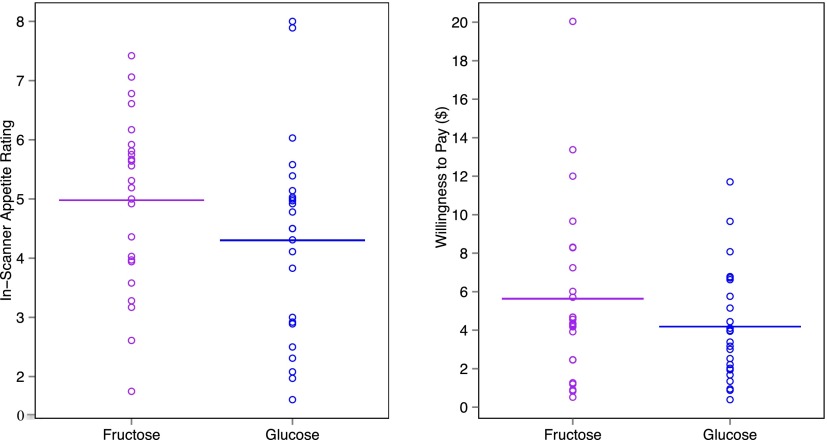
Fig. 2.
Fructose vs. glucose effects on appetite rating and willingness to pay. The x axis indicates drink type; fructose is labeled in purple and glucose is labeled in blue. (Left) The y axis indicates the composite in-scanner appetite rating score, with each circle representing each participant's rating across food- and nonfood-cue conditions and the solid line indicating the mean rating score. (Right) The y axis indicates the willingness-to-pay amount for immediate food rewards from the mixed-effects model (see Materials and Methods for details). Each circle represents each participant’s modeled average WTP amount, and the solid line indicates the mean WTP amount. Data are based on 24 participants.

