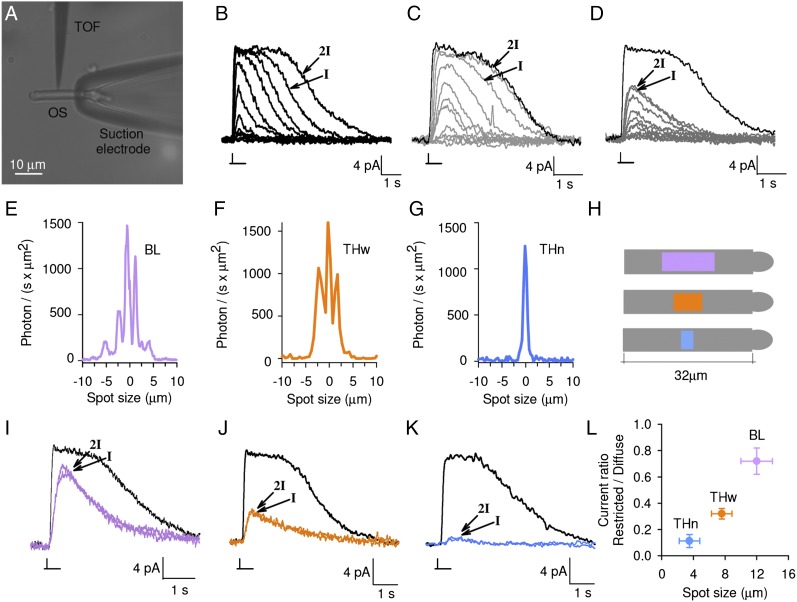
Fig. 1.
Photoresponses and spot size from apertureless TOFs. (A) A rod in physical contact with the TOF. (B) Family of photoresponses to diffuse light of increasing intensity. (C) Family of light responses obtained from flashes of light delivered by the TOF with an aperture of 300 nm (gray traces) compared with the photoresponse obtained with a diffuse saturating light (black trace). Gray traces were obtained with light flashes which had a Gaussian profile. (D) Family of light responses obtained from flashes delivered by an apertureless TOF (dark gray traces) compared with the photoresponse obtained with a diffuse saturating light (black trace). (E–G) Lateral profiles of the light intensity (laser power 10 mW) at 5 μm fiber-sensor distance for three different apertureless TOFs (BL: Bessel-like, violet; THw: wide top-hat–like, orange; THn: narrow top-hat–like, blue). (H) The portion of the OS illuminated by the three TOFs (same color code). (I–K) Photoresponses (colored traces) obtained from saturating light flashes delivered to the OS middle by the apertureless TOFs with the profiles shown in E, F, and G, respectively, compared with the photoresponse obtained with a diffuse saturating light (black trace). The trace indicated by 2I was obtained from a light flash with intensity twice that indicated by I (the intensities I and 2I are saturating light). (L) Relation between spot size and fractional amplitude of the maximal photoresponse for the three different apertureless TOFs (more details in Fig. 2). Data were expressed as the mean ± SEM.

