Fig. 4.
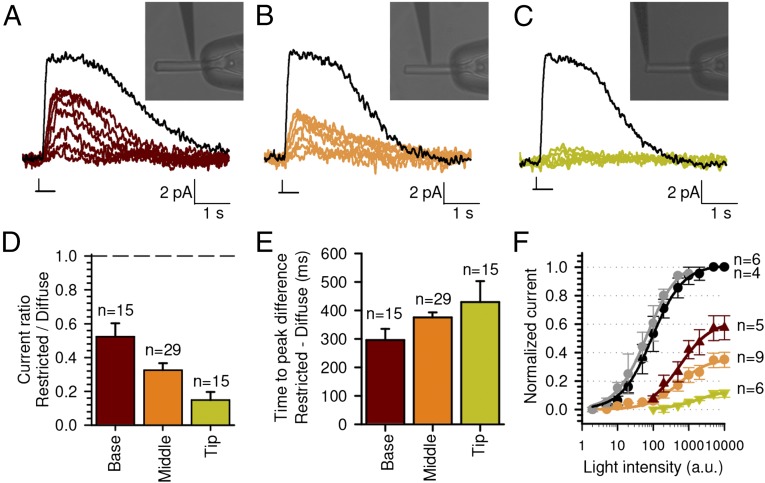
The gradient of phototransduction efficacy along the OS. (A) Family of photoresponses obtained with the TOF touching the base of the OS (purple traces), compared with the photoresponse to a diffuse saturating flash of light (black trace). The color traces were obtained when the profile of the light reaching the rod OS was as in Fig. 1F and the laser power was 100, 200, 500, 1,000, 2,000, 5,000, and 10,000 μW, respectively. (B) As in A but with the TOF touching the middle (orange traces). (C) As in A, but with the TOF touching the tip (green traces). Insets in A–C represent the position of the TOF. (D) Average fractional amplitude of the maximal photoresponse. (E) Average difference of time to peak from saturating flashes. Photoresponses in A–C are from the same rod and the series of flashes delivered by the TOF have the same intensity. (F) Normalized current–intensity response with diffuse (black circles), with light from 100 to 300 nm TOF (gray circles) and restricted light for the base (dark red), middle (orange), and tip (green) positions. The solid lines were fitted according to A = Amax·I/(I + B) using the following parameters: Amax = 1.0, 1.0, 0.62, 0.36, and 0.14 and B = 87, 67, 570, 520, and 1,750 arbitrary units (a.u.) for responses with diffuse (black), 100–300 nm TOF (gray) and restricted (colored) light, respectively. Data were expressed as the mean ± SEM for n experiments.

