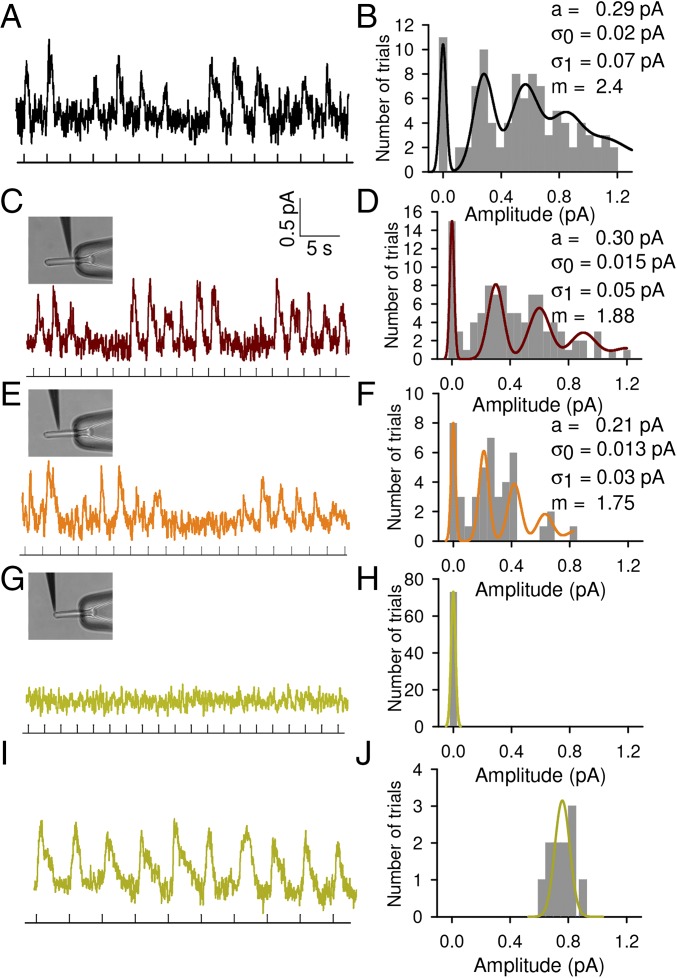
Fig. 7.
Single photon responses. (A) Photoresponses evoked by diffuse dim flashes of light. (B) Histogram of the amplitudes of evoked photoresponses fitted as described (n = 100). (C) Photoresponses evoked by dim flashes of light delivered at the indicated times by the TOF touching the base of the OS. (D) Histogram of the amplitudes of evoked photoresponses fitted as described (n = 100). (E and F) As in C and D, but when the TOF touched the middle (n = 44). (G and H) As in C and D, but when the TOF touched the tip (n = 70). (I and J) As in G and H, but increasing the flash intensity by 50 times (n = 9). Insets in C, E, and G represent the position of the TOF. The histograms (bin = 0.05 pA) were fitted with the equation described in Materials and Methods: values providing the best fit were reported; a is the mean response to single photon, σ0 is the noise SD, σ1 is the SD of the mean, and m is the mean number of events per trial. For diffuse, base, and middle the ensemble variance (σ2) is 0.08, 0.12, and 0.05 pA2, respectively, and the ratio between σ2 and mean of responses is 0.24, 0.31, and 0.18 pA, respectively.

