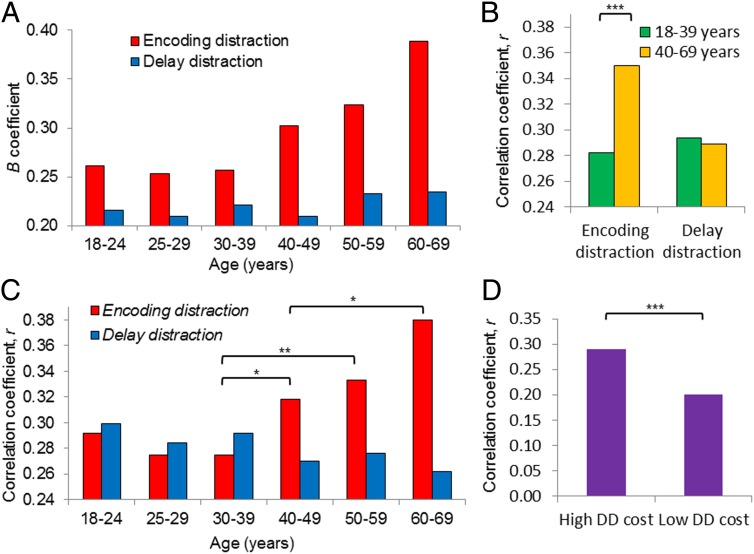
Fig. 3.
The association between ED and DD scores and WMC. (A) The B coefficients for ED (red) and DD (blue) for each age group from the regression model (ND score = α + B1 ED score + B2 DD score). (B and C) The correlation coefficients for partial correlations between ND score and ED score, controlling for DD score, and also between ND score and DD score, controlling for ED score. Results are shown for (B) participants of 18–39 y (green) and 40–69 y (orange) and (C) the six age groups. *P < 0.05; **P < 0.01; ***P < 0.001 (Fisher’s z test). (D) The correlation coefficients for partial correlations between ND score and ED score, controlling for DD score for older adults (40–69 y) with a high or low DD cost (a median split; the median was 10%).

