Fig. 4.
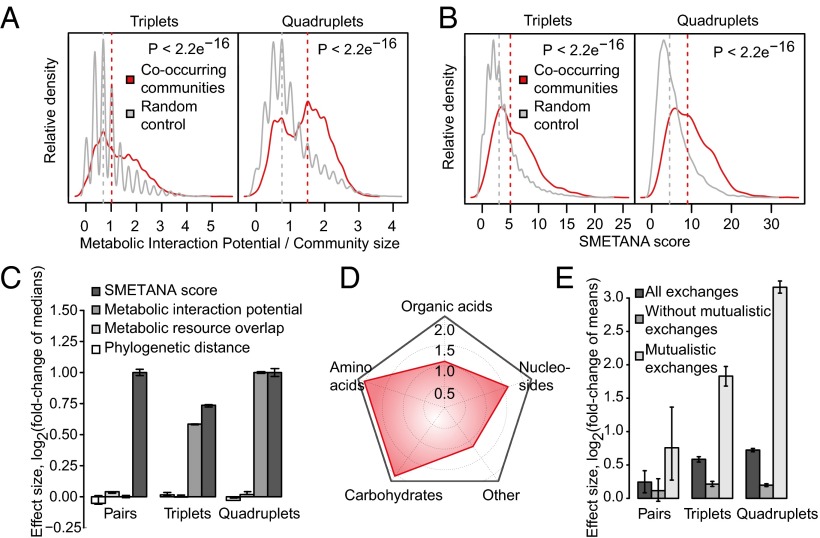
Co-occurring subcommunities feature high metabolic interaction potential. (A) MIPs of triplet and quadruplet subcommunities (red density plots) against the background of random assemblies (gray density plots, 10,000 groups). Shown MIP values are normalized by the number of member species. (B) Co-occurring subcommunities (red density plots) show stronger metabolic coupling than non-co-occurring groups (gray density plots, 10,000 groups). (C) Distinction of co-occurring subcommunities in various cooperation (MIP and SMETANA score) and competition (resource overlap and phylogenetic distance) metrics. Error bars mark the 5th and 95th percentile of ratios between these metrics for co-occurring subcommunities and the corresponding values for 1,000 random assemblies. (D) Metabolite classes likely to be exchanged in co-occurring subcommunities as predicted by SMETANA. Numbers mark the scale of log-fold enrichment over non-co-occurring groups. P < 10−7 (amino acids), < 10−5 (carbohydrates), < 10−2 (nucleosides), and 0.039 (organic acids). (E) Removal of mutualistic metabolite exchanges from simulated co-occurring communities diminishes the contrast to random assemblies. Error bars mark the 5th and 95th percentile of ratios between the number of edges in co-occurring communities and 1,000 random assemblies of the same size.

