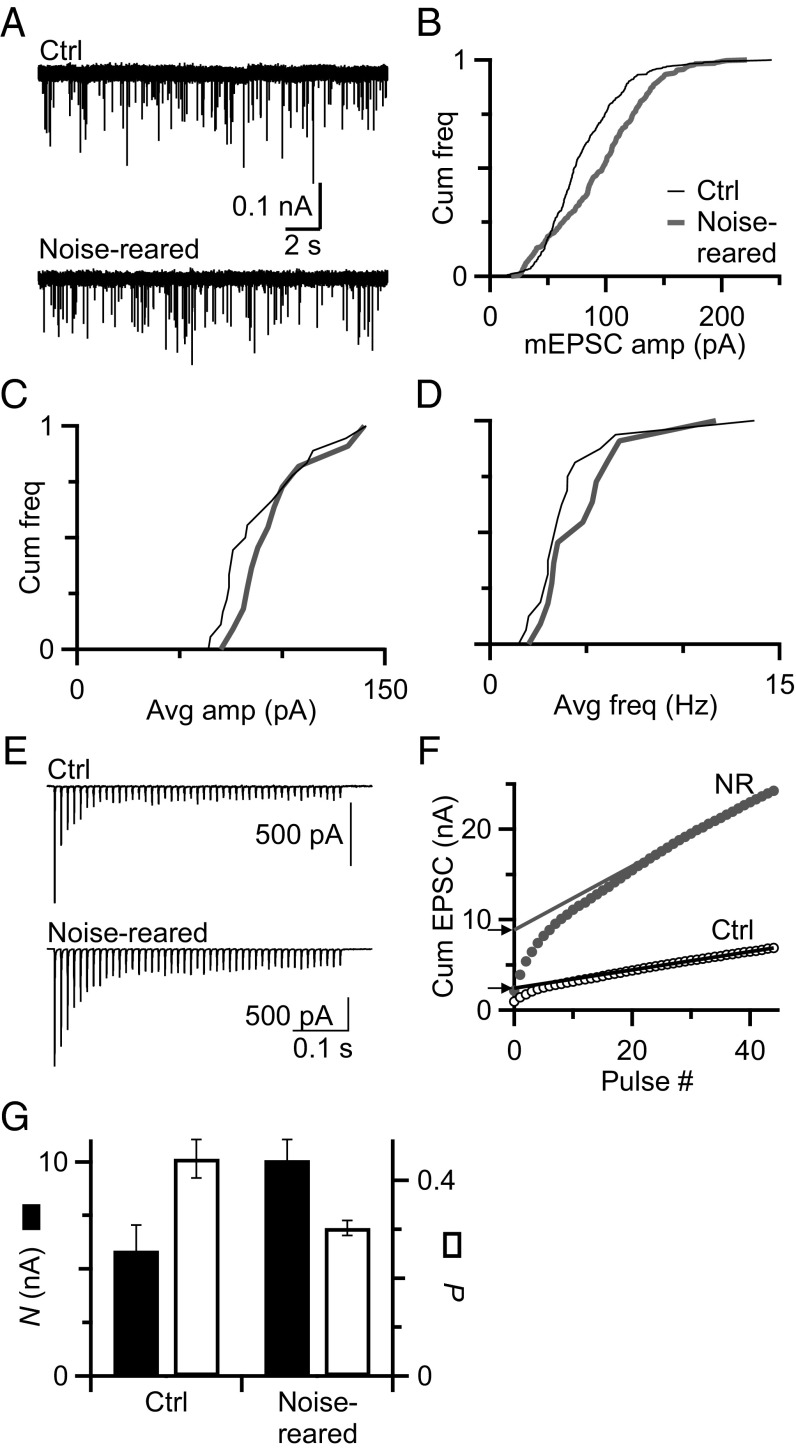
Fig. 2.
Noise rearing has no effect on mEPSCs. (A) Representative traces showing mEPSCs measured in BCs from control (Top) and noise-reared (Bottom) animals. (B) Cumulative histogram of mEPSC amplitude for the representative cells in A. (C) Cumulative histogram of average mEPSC amplitudes measured in BCs from control (n = 19) and noise-reared (n = 12) animals. The distributions do not differ significantly (P = 0.3, K–S test). (D) Cumulative histogram of mEPSC frequency in BCs from control (n = 19) and noise-reared (n = 12) animals. The distributions of frequency do not differ significantly (P = 0.37). (E) Representative EPSC trains recorded in the presence of 1 mM kynurenate from a control and noise-reared BC in response to stimulation of a single presynaptic AN fiber (45 pulses, 100 Hz). (F) Derivation of N and Pr from trains data in E, using the integration method. EPSC amplitudes are integrated, and a fit is extrapolated back to the y axis. Arrowheads mark the estimated value of N. Pr is calculated by dividing the first EPSC by N. (G) Average Pr and N measured using the integration method. Noise-reared endbulbs have significantly lower Pr (0.30 ± 0.01, P < 0.005) and larger N (10.1 ± 0.1 nA, P < 0.05) compared with control (Pr = 0.45 ± 0.04, N = 5.9 ± 1.2 nA).

