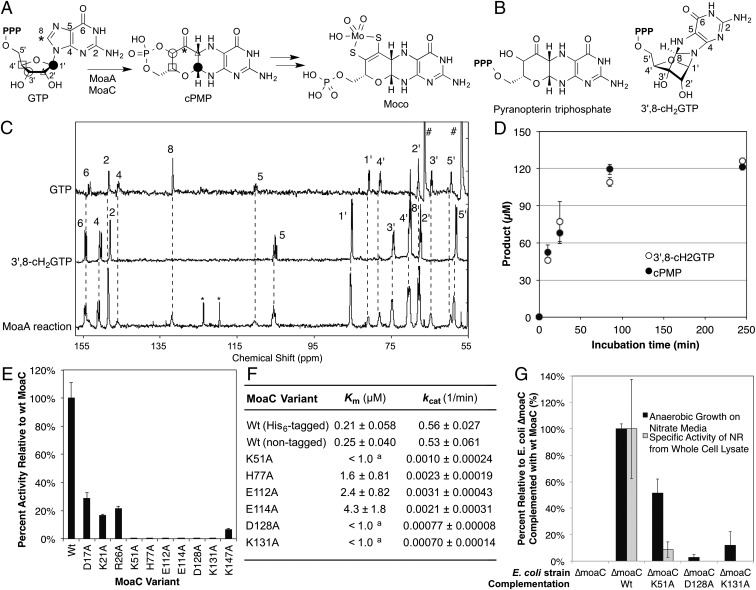
Fig. 1.
In vivo and in vitro functional characterization of MoaC. (A) Moco biosynthesis. Symbols indicate the fate of each atom (4). cPMP may also be in a hydrate form in solution (14). (B) Previously proposed structures for the MoaA product. (C) In situ 13C NMR characterization of the MoaA product. Shown are the 13C NMR spectra of [U-13C]GTP (Top), purified [U-13C]3′,8-cH2GTP (Middle), and the MoaA (0.4 mM) reaction using [U-13C]GTP (1 mM) as the substrate (Bottom). Numbers are the signal assignments for atoms labeled in A and B. Signals highlighted by * and # are derived from toluensulfonate and glycerol, respectively. (D) Timecourse of the formation of the biosynthetically relevant MoaA product based on the quantitation of 3′,8-cH2GTP before (open circles) or after (filled circles) its conversion to cPMP. The assay solution contained 65 μM WT-MoaA, 0.2 mM GTP, and 1 mM SAM. (E) In vitro activity of WT and variants of MoaC determined by a coupled assay with MoaA. (F) Steady-state kinetic parameters for WT and variants of MoaC. The assays were performed in the absence of MoaA by using purified 3′,8-cH2GTP as a substrate. a, only the upper limit (1.0 μM) was determined because the reaction rate became impractically low below this substrate concentration. (G) Moco production in E. coli ΔmoaC expressing WT or variants of MoaC based on anaerobic growth rates (black bars) or NR activity (gray). All data in D–G are average of at least three replicates, and the errors are based on SDs.

