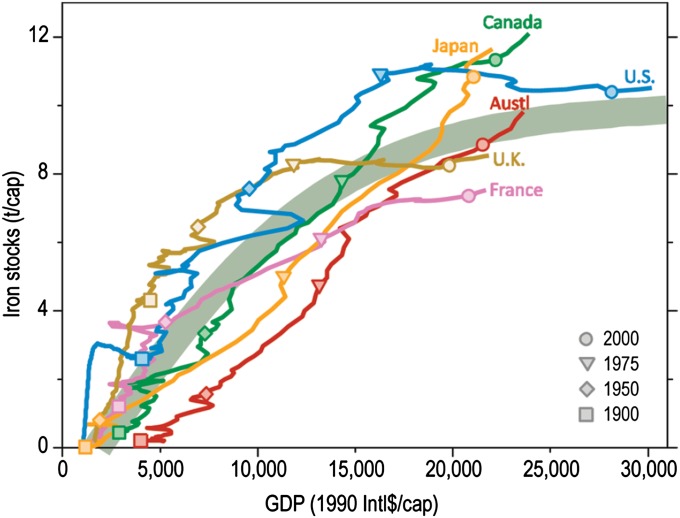
Fig. 6.
Per capita iron stocks in use vs. per capita gross domestic product (GDP) purchasing power parity (1990 international dollars). Iron stock data are based on medium lifetime assumptions, except for Japan, where lower lifetime estimates were applied. The thick gray-green line is a fitted logistic growth curve used to estimate the contemporary iron stocks in other countries. Reprinted with permission from ref. 27. Copyright 2011 American Chemical Society.

