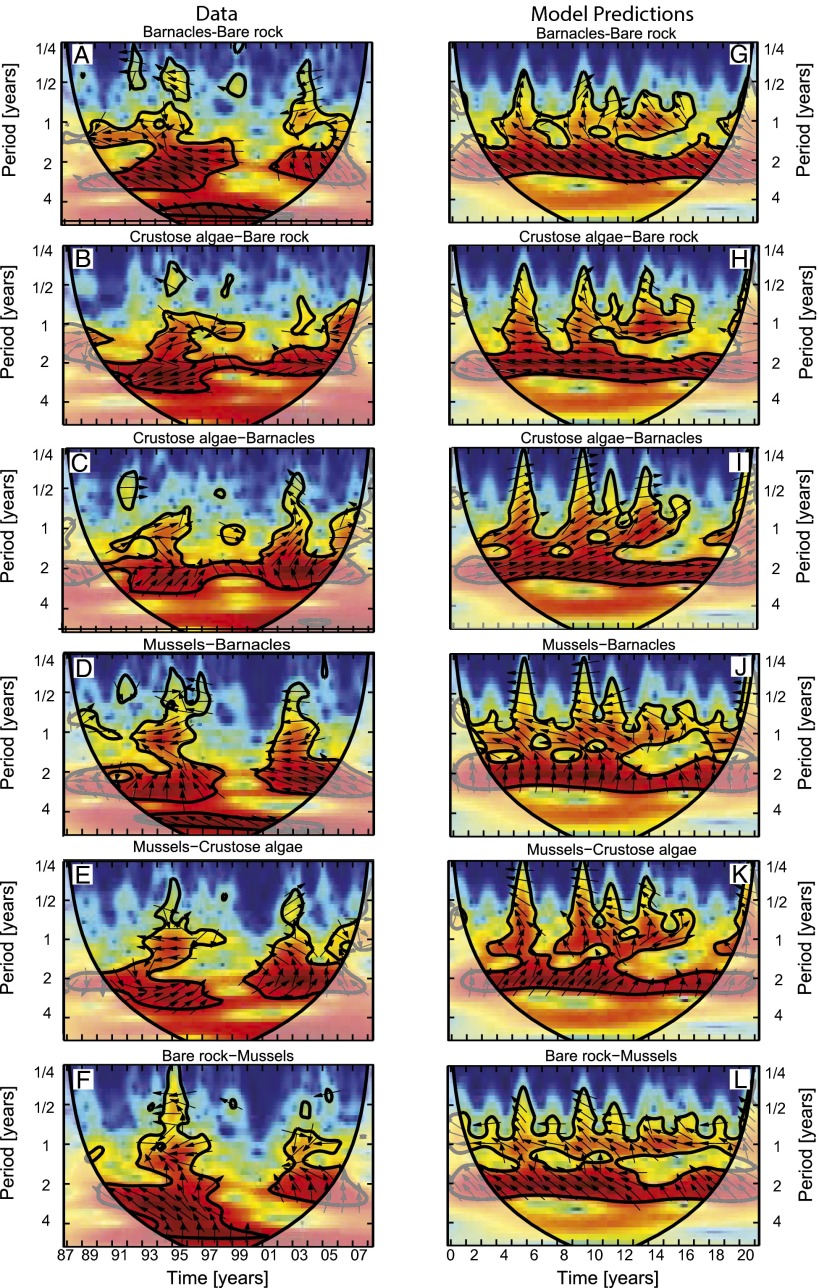
Fig. 3.
Cross-wavelet spectra of all species pairs. Cross-wavelet spectra of (A–F) the observed time series (Fig. 2 B–E) and (G–L) the model predictions (Fig. 5 H–K). The spectra show how common periodicities in the fluctuations of two species (y axis) change over time (x axis). Color indicates cross-wavelet power (from low power in blue to high power in red), which measures to what extent the fluctuations of the two species are related. Black contour lines enclose significant regions, with >95% confidence that cross-wavelet power exceeds red noise. Arrows indicate phase angles between the fluctuations of the two species. Arrows pointing right represent in-phase oscillations (0°), and arrows pointing upward indicate that the first species lags the second species by a quarter period (90°). Shaded areas on both sides represent the cone of influence, where edge effects may distort the results.

