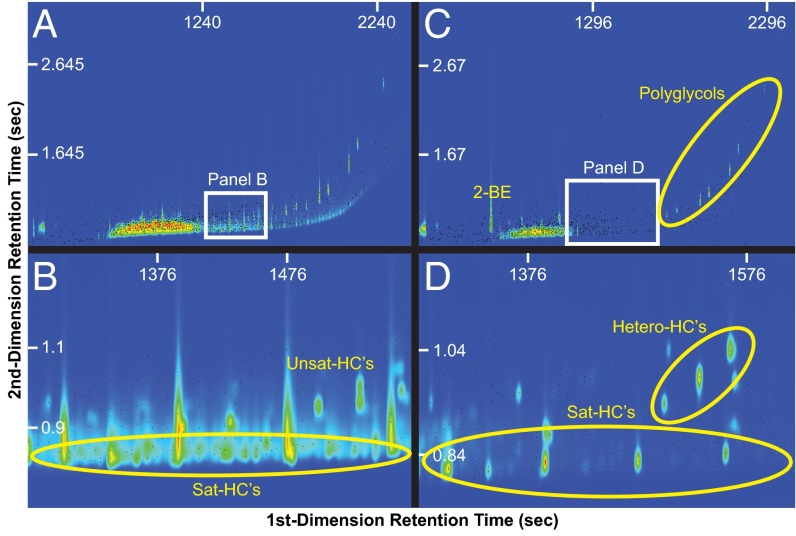
Fig. 3.
GCxGC-TOFMS chromatograms of flowback water. (A) Example from a gas well in Connelsville, PA. (B) Magnified portion of A as indicated by white rectangle. (C) Example from a gas well in Kittanning, PA. (D) Magnified portion of C as indicated by white rectangle. General compound classes are illustrated in panels. Unresolved complex mixture (UCM) concentrations are relative to each panel, but increase in concentration from cool (e.g., blue) to bright (e.g., red) color.

