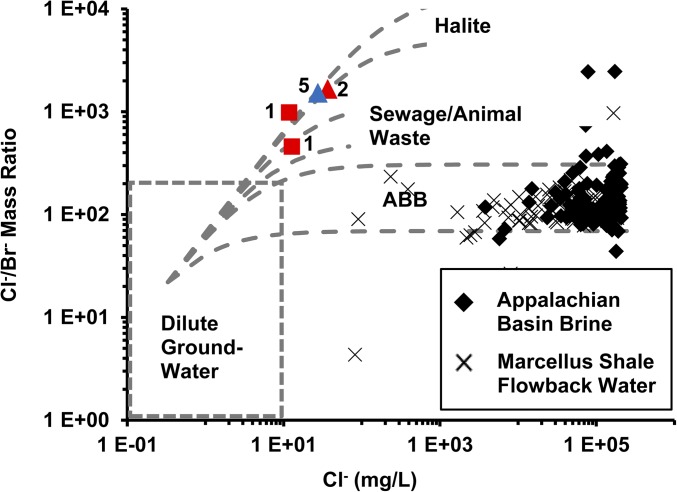
Fig. 6.
Crossplot of Cl/Br mass ratio vs. Cl concentrations for samples collected from Wells 1, 2, and 5 (labeled) with bounding upper and lower conservative mixing curves for various endmembers (e.g., Appalachian Basin brine, sewage and animal waste, and halite sources). Appalachian Basin brine samples (20–22, 24) and Marcellus Shale flowback samples (23, 25, 26) are also plotted for comparison.

