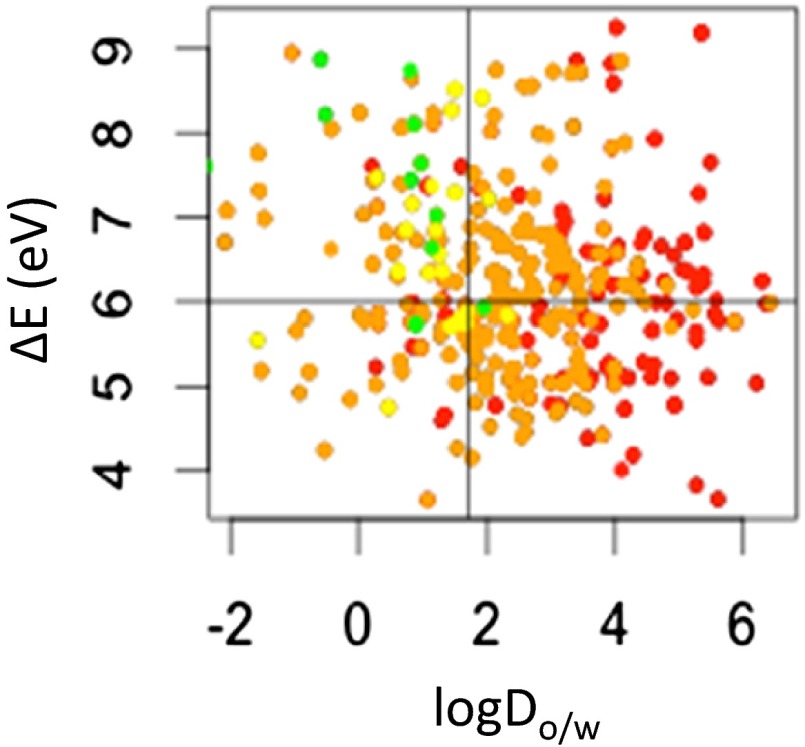
Fig. 4.
Scatter plot of octanol-water distribution coefficient at pH 7.4 (logDo/w) vs. the energy difference between the highest occupied and lowest unoccupied frontier orbitals. ΔE (eV) for 345 compounds, colored by category of concern for acute aquatic toxicity based on a 48-h toxicity assay of Daphnia magna (48). (red, high concern; orange, medium concern; yellow, low concern; green, no concern).

