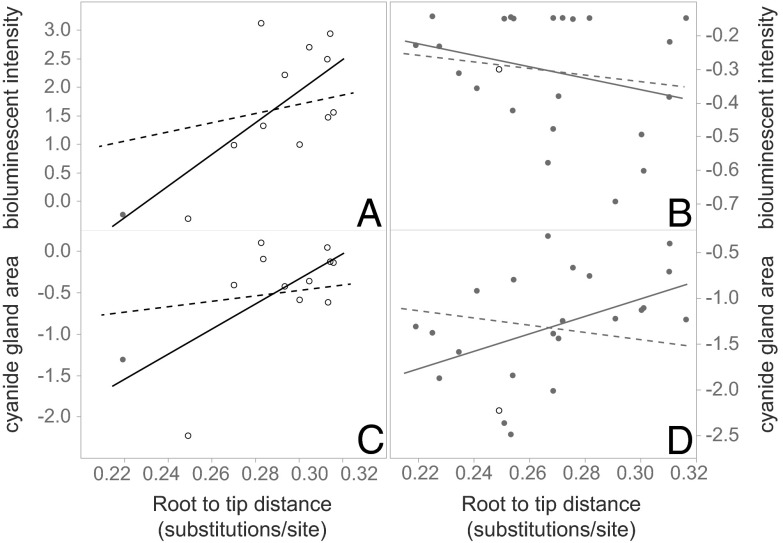
Fig. 3.
Tests of phylogenetic escalation of bioluminescent intensity and cyanide gland area. (A) In luminescent millipedes, a positive linear relationship exists between a taxon’s luminescent intensity and its phylogenetic distance from the root. (C) A similar relationship is observed between its toxicity and phylogenetic distance. (B and D) A weak negative or no evidence of a correlation is evident between luminescence and toxicity with phylogenetic distance in nonluminescent taxa. Raw luminescent data points are shown for clarity of illustration. Open circles denote luminescent taxa, and dots indicate nonluminescent taxa. Regression lines: phylogenetically corrected values (dotted), uncorrected raw values (solid).

