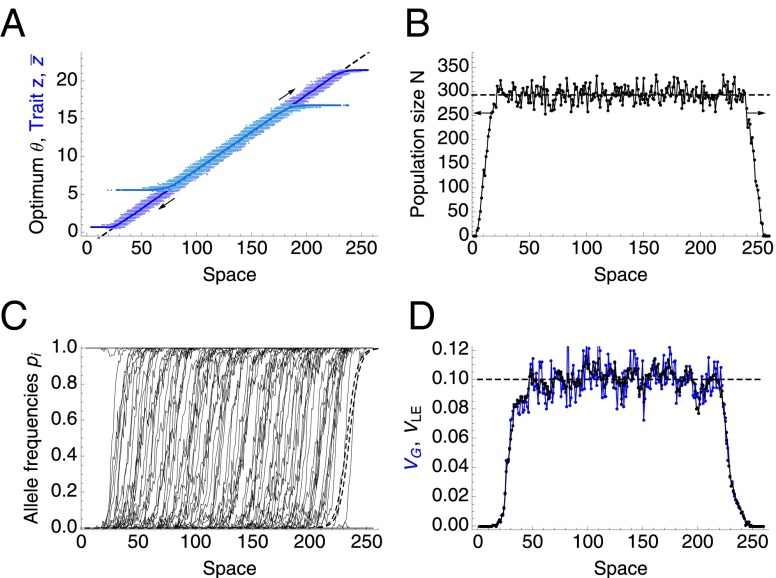
Fig. 1.
Illustration of the individual-based model at the limit of weak genetic drift, when the species’ range keeps expanding as predicted by the deterministic model (11). (A) Trait mean matches the optimum (dashed line), shown for the starting population (light blue) and after 5,000 generations (dark blue). The spread of the trait values z for all individuals is shown with dots. (B) Local population size is close to the deterministic prediction (dashed line) , where K gives the carrying capacity for a well-adapted phenotype. (C) Clines for allele frequencies are shown by thin black lines; the predicted clines (dashed) have widths and are spaced apart. (D) Total genetic variance is shown in blue, and the linkage equilibrium component is shown in black; the dashed line gives the prediction : each cline contributes genetic variance , and per unit distance, there must be clines if the trait mean matches into the optimum (11, p. 378). Parameters, defined in Table 1, are as follows: , , , , , , , 5,000 generations.

