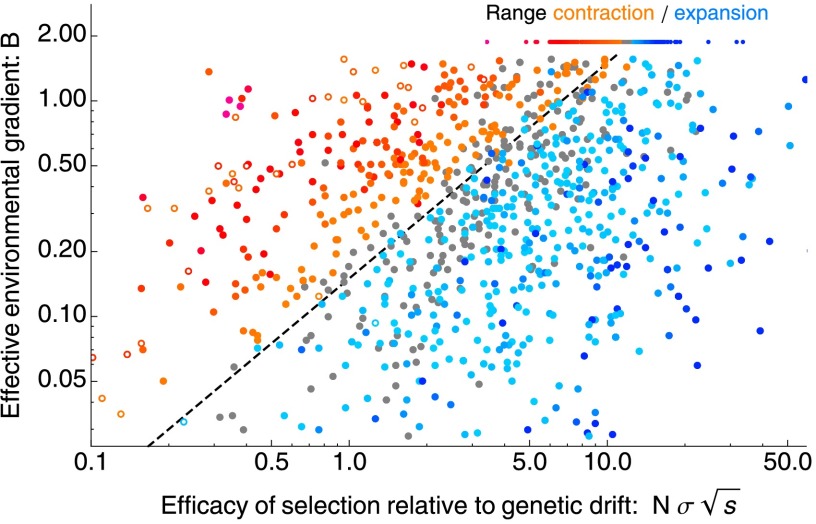
Fig. 2.
Species’ range starts to contract when the effective environmental gradient is steep compared with the efficacy of selection relative to genetic drift: , where . This threshold is shown by a dashed line. The rate of expansion increases from light to dark blue and rate of range contraction increases from orange to red. Gray dots denote populations for which neither expansion nor collapse is significant at . Open dots indicate fragmented species’ ranges (illustrated by Fig. S3). The ranges of the underlying (unscaled) parameters are in the following intervals: , , , , and , ; the number of genes is between 7 and 3,971. The selection coefficient per locus is hence in the interval of , with median of 0.007. Parameter distributions are shown in Fig. S1.

