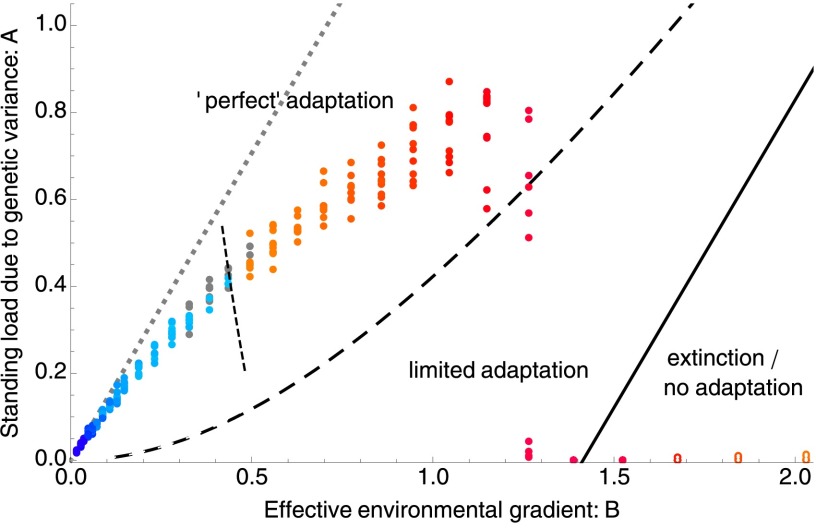
Fig. 4.
The phenotypic model predicts a second sharp transition in the dynamics (, dashed curve). As the effective environmental gradient increases, the scaled variance increasingly deviates from the deterministic prediction with evolvable variance (11) (gray dotted line). The variance decreases due to the combined forces of genetic drift (Fig. S2A) and selection on small transient deviations of the trait mean from the optimum. Once (dashed curve), the population collapses abruptly. Furthermore, no adaptation is maintained beyond the solid line , where the phenotypic model (9) predicts extinction. Open dots (Lower Right) denote fragmented species’ range (Fig. S3). The colors are as in Fig. 2; the threshold when range starts to contract, , is illustrated by the short steep dashed line. Parameters are as follows: b increases from 0.025 to 1.25, , , , , , 5,000 generations. Ten replicates are shown for each B.

