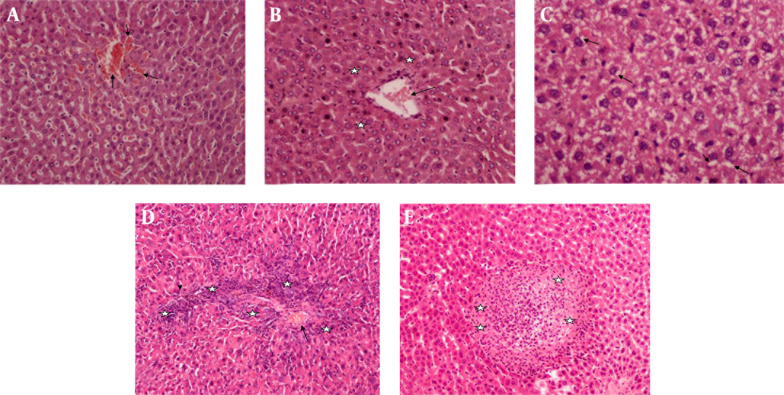
Figure 2. Diazinon Group.
A, Dilatation in sinusoids (arrows) (H & E × 40); B, Cellular disruption (stars) around central vein (arrow) (H & E × 40); C, Vacuolation (arrows) (H & E × 200); D, Mononuclear inflammatory cells (stars) among hepatic cells, around the central vein (arrow) and portal space (arrow head) (H & E × 40); E, Hepatocellular necrosis (stars) (H & E × 40).

