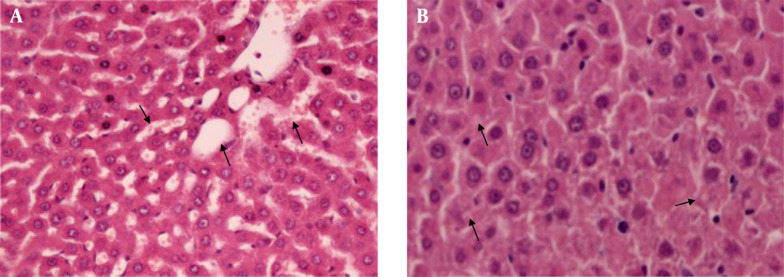
Figure 3. Diazinon + Silibinin Group.

A, Mild dilatation in sinusoid (arrows) (H & E × 100); B, Minimal vacuolation (arrows) (H & E × 200); C: Mild inflammation (stars) around the central vein (arrow) and portal space (arrow head) (H & E × 100).

A, Mild dilatation in sinusoid (arrows) (H & E × 100); B, Minimal vacuolation (arrows) (H & E × 200); C: Mild inflammation (stars) around the central vein (arrow) and portal space (arrow head) (H & E × 100).