Figure 2. Metabonomic Analysis.

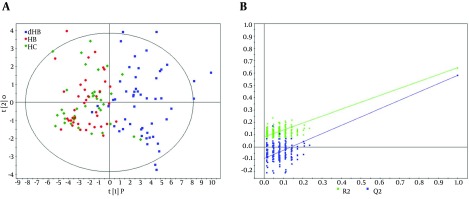
A, The score plots of the OPLS-DA model showing an obvious separation between depressed subjects (blue box, HB-D) and non-depressed subjects (red dot, HB; green diamond, HC); B, 199 permutation test.

A, The score plots of the OPLS-DA model showing an obvious separation between depressed subjects (blue box, HB-D) and non-depressed subjects (red dot, HB; green diamond, HC); B, 199 permutation test.