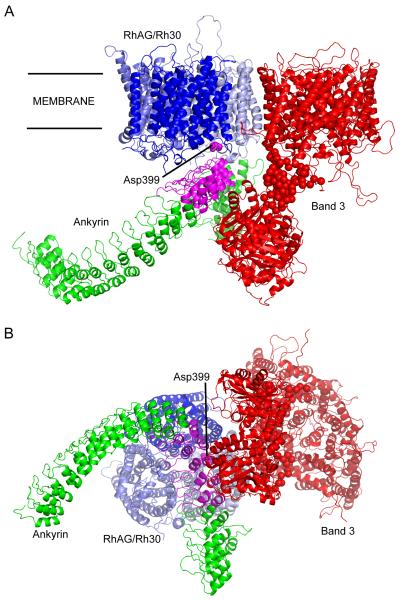
Figure 3. Ankyrin-band 3-RhAG/Rh30 complex.
(A) view from within the plane of the membrane; (B) view from the cytoplasm. Proteins are displayed as Cα cartoon, ANK repeat region of ankyrin in green (D2 region in magenta), band 3 in red, RhAG in light blue, RhCE in mid-blue and RhD in dark blue. RhAG residue D399 (associated with ankyrin binding) is coloured magenta, and displayed as spheres. For interpretation of the references to colour in this figure legend, the reader is referred to the web version of this article.

