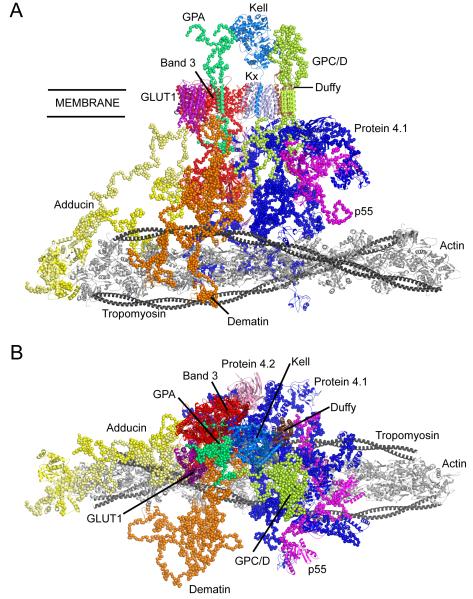
Figure 5. Overall model of junctional complex.
(A) view from within the plane of the membrane; (B) view from outside of the cell. The components shown in the figure are: one band 3 homodimer (red), five protein 4.1R monomers (dark blue), one GPA homodimer (mint-green), a cluster of five GPC/D monomers (lime-green), one DARC monomer (brown), one α/β-adducin heterodimer (bright/pale yellow, respectively), one dematin trimer (orange), one GLUT1 monomer (purple), one protein 4.2 monomer (pink), one Kell monomer (mid-blue), one Kx monomer (light blue), two p55 monomers (magenta), one actin filament (light grey) and two tropomyosin homodimers (dark grey). All components are shown with secondary structure elements highlighted as cartoons and residues predicted to be disordered displayed as spheres centred on the Cα atoms. For interpretation of the references to colour in this figure legend, the reader is referred to the web version of this article.

