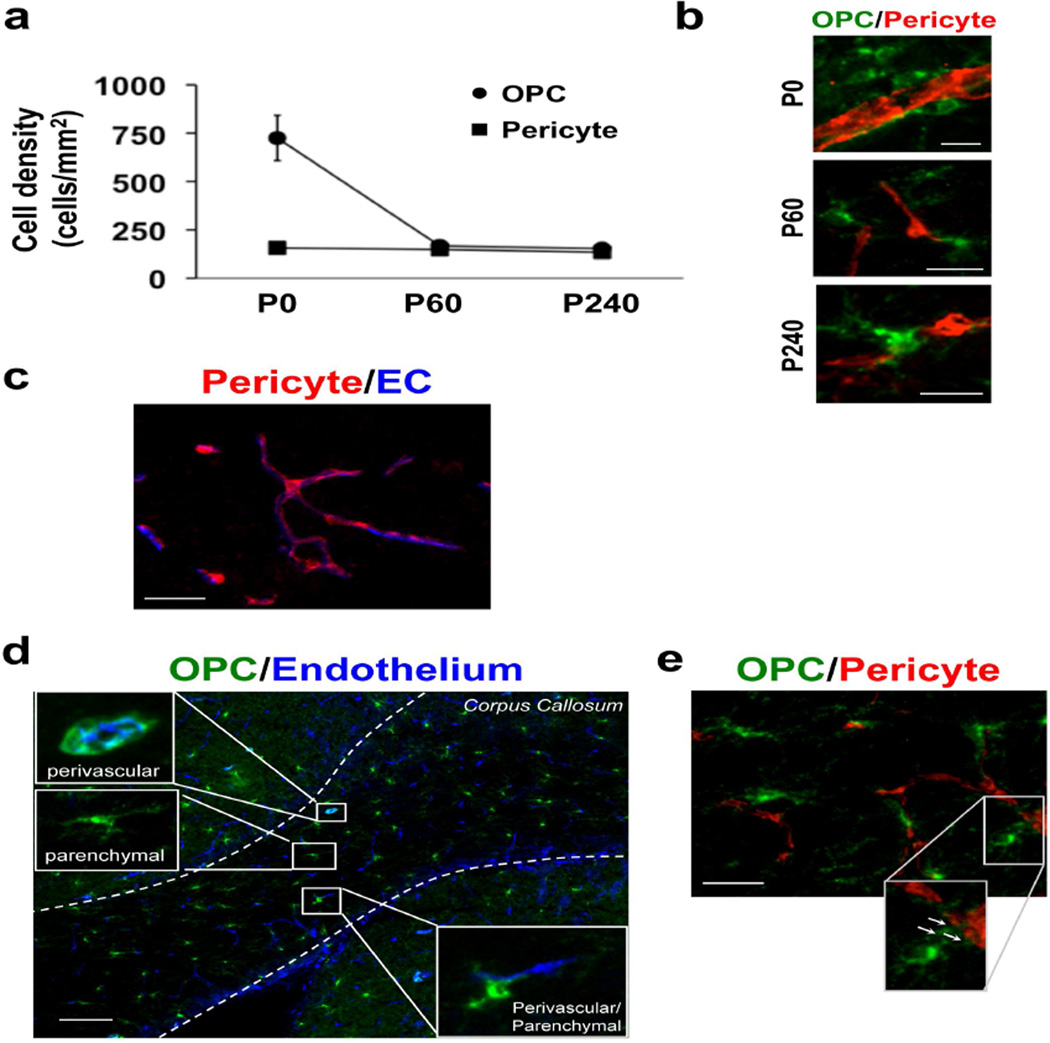
Figure 1. Interaction between pericytes and OPCs in mouse corpus callosum.
(a) Histograms showing the density of PDGFR-α-positive OPCs and PDGFR-β-positive pericytes in corpus callosum in mice at postnatal days 0, 60, and 240. (b) Representative images of PDGFR-α (green: OPC) and PDGFR-β (red: Pericyte) immunostaining in corpus callosum in mice at postnatal days 0, 60, and 240. Scale bar = 20 μm. (c) Representative images of PDGFR-β (red: Pericyte) and lectin (blue: Endothelium) immunostaining in mouse corpus callosum at postnatal day 60. Scale bar = 50 μm. (d) Representative images of PDGFR-α (green: OPC) and lectin (blue: Endothelium) immunostaining in mouse corpus callosum at postnatal day 60. There are "perivascular" OPCs, parenchymal OPCs, and "intermediate (perivascular/parenchymal) " OPCs in the mouse white matter. Scale bar = 100 μm. (e) Double-immunostaining of PDGFR-α (green, OPCs) and PDGFR-β (red, pericytes) show that “perivascular/parenchymal OPCs” extend their processes to pericytes. Arrows indicate OPC processes that attach to pericytes. Scale bar = 50 μm.

