
Figure 2.
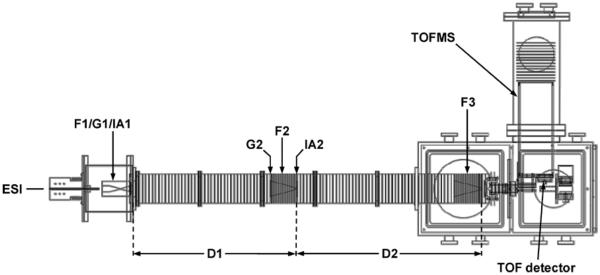
Schematic diagram of the IMS-MS instrument used in this study. Ion gates (G1 and G2), funnels (F1, F2, and F3), and activation regions (IA1 and IA2) are labeled. See text for details of instrument operation.
Official websites use .gov
A
.gov website belongs to an official
government organization in the United States.
Secure .gov websites use HTTPS
A lock (
) or https:// means you've safely
connected to the .gov website. Share sensitive
information only on official, secure websites.
Schematic diagram of the IMS-MS instrument used in this study. Ion gates (G1 and G2), funnels (F1, F2, and F3), and activation regions (IA1 and IA2) are labeled. See text for details of instrument operation.