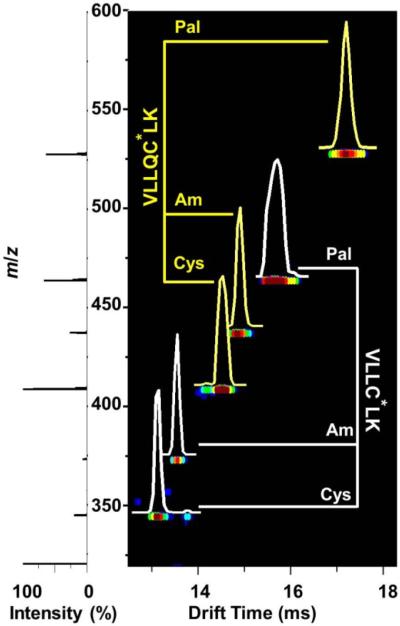
Figure 3.
Nested IMS-MS dot plots of the electrosprayed mixture of two peptide sequences containing Cys, CysAm, or CysPal residues. The sample concentration of each component is ~0.01 mg·mL−1 in 1:1 water:acetonitrile with 0.1% formic acid. The intensities of different features are represented using a false color scheme where the least intense features are shown in dark blue and the most intense are shown in red. The compressed mass spectrum displayed on the left is obtained by integrating across the entire range of m/z for each drift time. Drift time distributions are normalized to the peak height and overlayed for each peptide ion (VLLQC*LK and VLLC*LK are displayed in yellow and white, respectively). Within each sequence, C* annotates the modification site as the Cys residue. A branched scheme refers to peaks that correspond to each variable modification [unmodified (Cys) or modified with a carboxyamidomethyl (Am) or palmitoyl (Pal) group].

