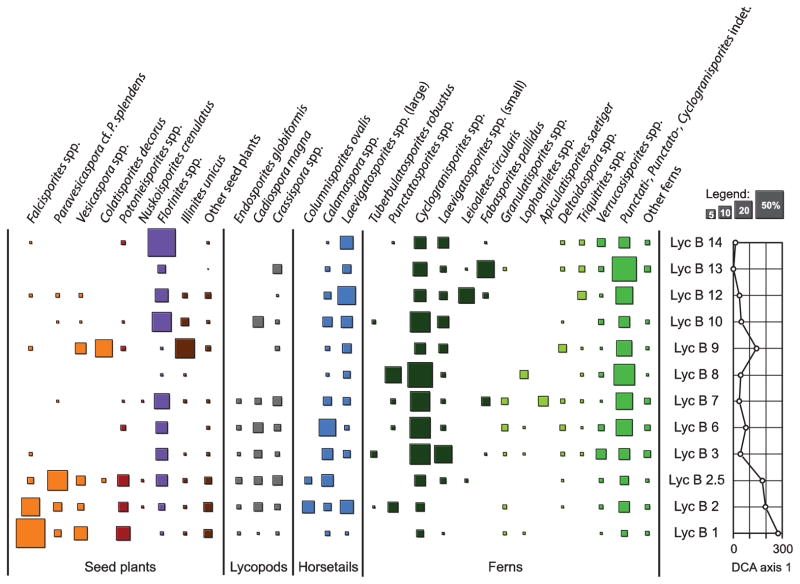
Fig. 3.
Taxonomic composition and percent relative abundance of selected pollen and spore types per sample. Palynomorph taxa or groups of taxa are clustered according to their botanical affinity. The surface area of each square is a measure for a taxon’s realtive abundance in a sample. As a summarizing measure for the dominant compositional changes along the section, the sample scores on the first axis of a DCA (see Fig. 5) are plotted on the right. Colors (from left to right): orange = seed ferns; red = conifers; purple = cordaitaleans; brown = other seed plants; grey = lycopods; blue = horsetails; dark green = tree ferns; light green = herbaceous ferns; intermediate green = other ferns.

