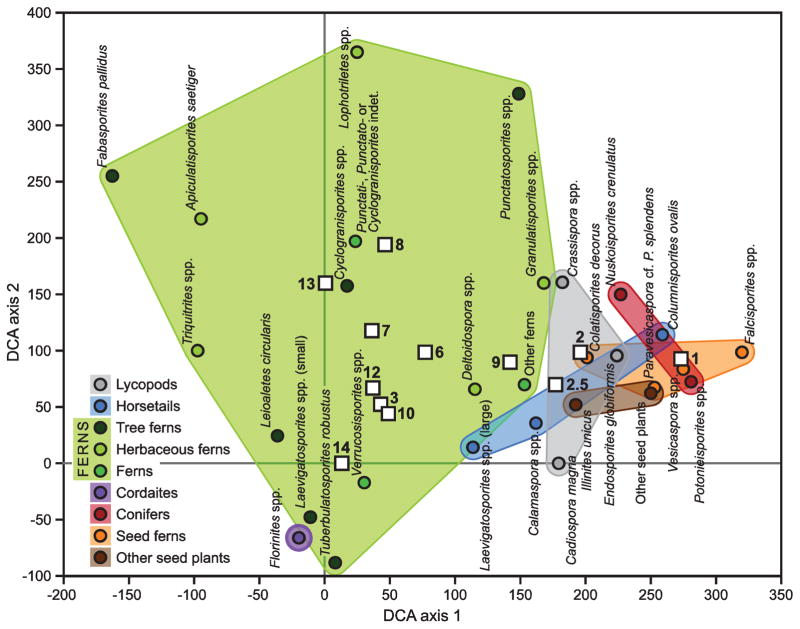
Fig. 5.
Ordination of palynomorphs from the Lycopod B sequence, based on a Detrended Correspondence Analysis (DCA) of the data. Selected palynomorph taxa (or groups of taxa) are plotted as colored dots on the first two DCA axes, which respectively account for 26.4 and 10.5% of the variance in the species data. The palynomorphs are grouped in colored convex envelopes, based on their botanical affinity. In this biplot, samples are shown as white squares; their numbers refer to the ‘LycB90’ sample numbers.

