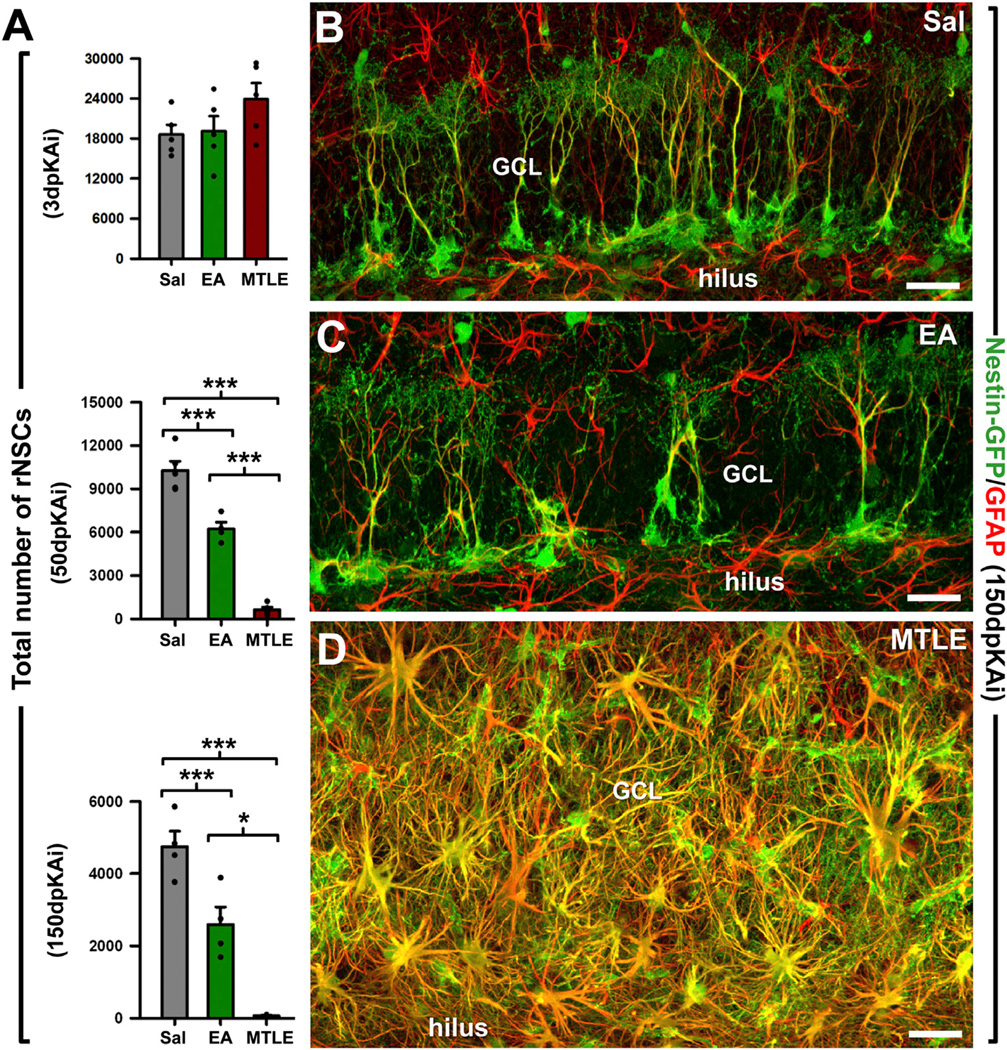
Figure 5. EA and MTLE Deplete the rNSC Population.
(A) Quantification of rNSCs (defined as Nestin-GFP cells whose soma was located in the SGZ and with a radial process immunostained for GFAP crossing the GCL) at 3, 50, and 150 dpKAi. Note the difference in the y axis scale across different time points examined. *p < 0.05, ***p < 0.001 by all pairwise multiple comparison by Holm-Sidak post hoc test. Bars show mean ± SEM. Dots show individual data.
(B–D) Representative confocal microscopy images from the DG of Sal (B), EA (C), and MTLE (D) Nestin-GFP mice after staining GFP and GFAP at 150 dpKAi. Scale bar is 40 µm in all images. GCL, granule cell layer.

