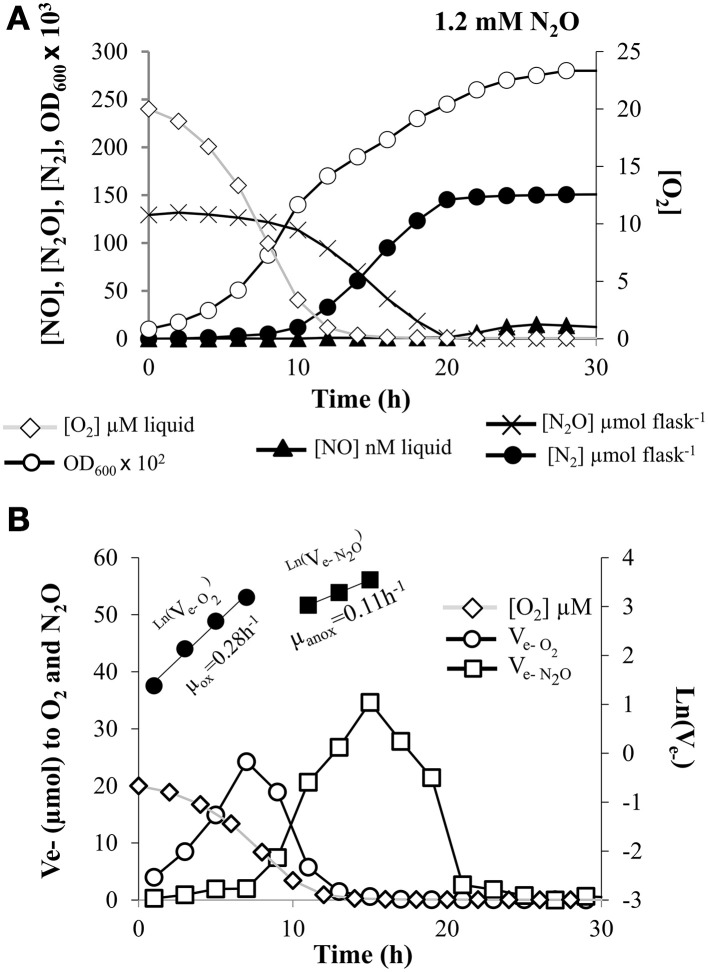
Figure 3.
Kinetics of O2 and N2O respiration. (A) Absorbance at 600 nm (OD600), O2 and N2O depletion, and production of NO, and N2 by E. meliloti 1021 when incubated in the presence of 10 mM NO−3 in the medium and an initial O2 concentration of 2% in the headspace plus 5% N2O. (B) The electron flow to O2 or to N2O is shown as log-transformed values for the oxic (filled circle symbols) and anoxic phase (filled square symbols) with exponential increase. The slopes estimating apparent growth rates were 0.28 (±0.03) h−1 for the oxic phase, and 0.11 (±0.03) h−1 for the anoxic phase, respectively. Cultures with an initial OD600 of 0.01 were vigorously stirred at 700 rpm. The result shown is for a single vial. Three replicates were analyzed in parallel with similar results. Consistency of the observations are demonstrated in Table 1 where averages of at least three different cultures are reported.

