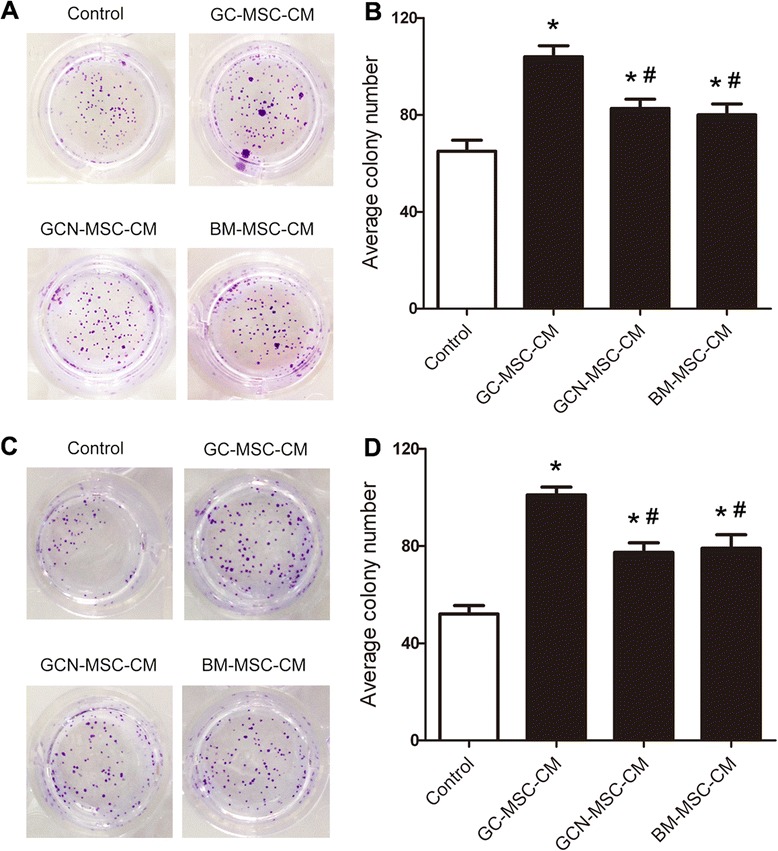
Fig. 3.

Effect of GC-MSCs on gastric cancer cell proliferation assessed by CFU assay. (A) Representative images of BGC-823 cell colony formation treated with 10 % CM from GC-MSCs, GCN-MSCs, or BM-MSCs. (B) Average colony numbers ± SD were plotted of BGC-823 cells in different groups (n = 3). (C) Representative images of MKN-28 cell colony formation treated with 10 % CM from GC-MSCs, GCN-MSCs, or BM-MSCs. (D) Average colony numbers ± SD were plotted of MKN-28 cells in different groups (n = 3). *P < 0.05: compared with the control group; # P < 0.05: compared with the GC-MSC-CM treated group
