
Fig. 2.
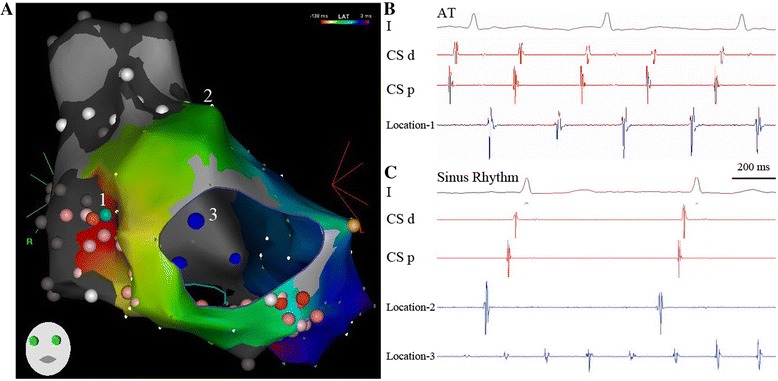
In Panels A and B, activation mapping from the donor atria indicates an origin of a focal AT at the suture line (border zone, location 1). The red color represents the earliest activation. At this site, radiofrequency current is applied and terminates AT. Red and pink points indicate the ablation areas. The color’s strength represents the duration of ablation delivery. Panel C shows the patient’s sinus rhythm with a cycle length of 800 ms. The ablation catheter at location 2 (anterior-superior wall of the donor atrium) indicates sinus rhythm. Af at the ablation catheter in the recipient atria (blue point, location 3) is not changed, but the two atria are electrically dissociated