
Fig. 5.
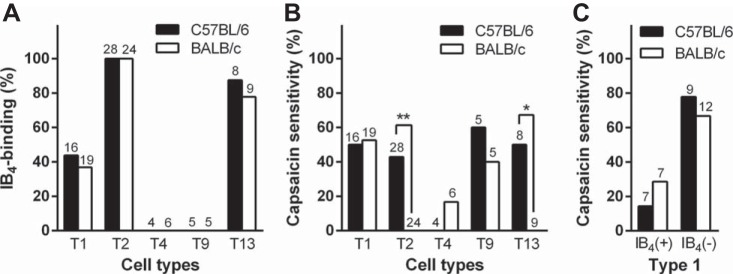
IB4-binding property and capsaicin sensitivity in each TG cell type. A: bar graph depicts IB4-positivity within the different populations of TG neurons for each mouse strain. B: bar graph depicts capsaicin sensitivity within the different populations of TG neurons for each mouse strain. There were strain differences in capsaicin-sensitivity in types 2 and 13 cells. *P < 0.05 and **P < 0.01, between strains (Fisher's exact test). C: capsaicin sensitivity in IB4(+) and IB4(−) subpopulations in type 1. Numbers on the top of bars or open sites on x-axis represent the number of total cells.