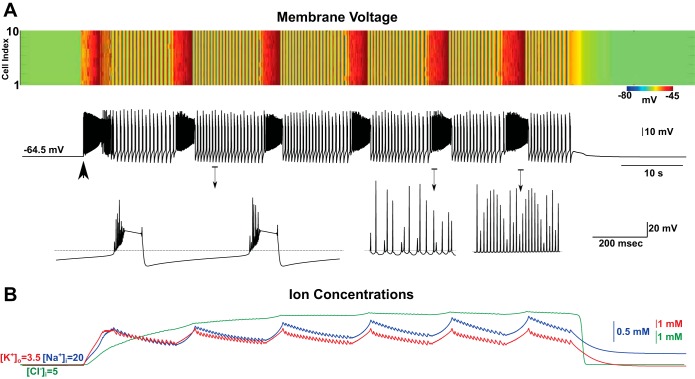
Fig. 2.
Spontaneous termination of seizure in the network model. A, top: image plot of the membrane voltage of all pyramidal (PY) neurons (light colors indicate depolarized potentials) from the network of 10 PY and 2 interneuron (IN) cells; bottom (in black): activity of a single representative PY neuron from the network (neuron #5). Transient direct current (DC) stimulation (2 s) was applied to all PY cells (indicated by large, black arrow). The membrane voltage revealed several state transitions between tonic (fast runs; bottom right) and clonic (bursting; bottom left) periods before termination of seizure-like activity. B: time evolution of [K+]o (red curve), [Na+]i (blue curve), and intracellular chloride concentration ([Cl−])i (green curve).

