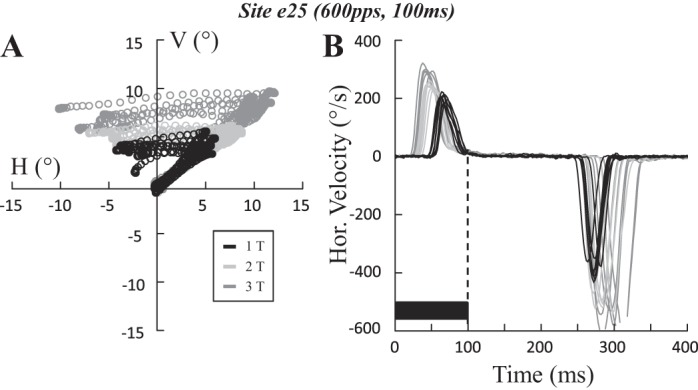
Fig. 11.

Rebound saccade after the ipsilateral saccade. Spatial trajectory (A) and time course of the horizontal velocity (B) of saccades evoked at site e25 (100 ms, 600 pps) are shown when the stimulation current was increased from one (1T = 15 μA; black) to two (2T; light gray) and 3 times threshold (3T; dark gray). The ipsilateral saccade is followed by a contralateral rebound saccade. Note how the onset of the rebound is timed to the offset of stimulation. The horizontal amplitude of ipsilateral saccades increased with the stimulation current, from 4.6 ± 0.2 (1T) to 7 ± 0.3 (2T) and 9.2 ± 0.6° (3T). Similarly, that of the rebound saccades increased from −7.8 ± 0.3 (1T) to −12 ± 0.6 (2T) and −16.8 ± 1.2° (3T). The latency of ipsilateral saccades decreased with the stimulation current, from 56 ± 1 (1T) to 35 ± 1 (2T) and 29 ± 2 ms (3T). Latency for the rebound saccades increased from 156 ± 2 (1T) to 164 ± 3 (2T) and 173 ± 4 ms (3T) with respect to the end of the stimulation train. Values are means ± SD. H, horizontal; V, vertical.
