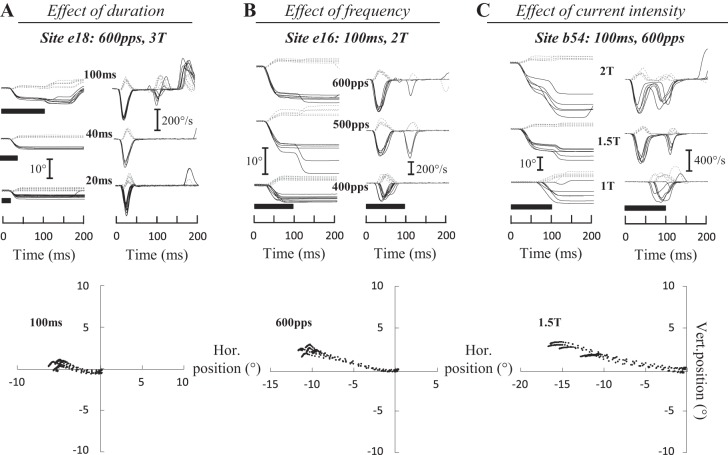
Fig. 2.
Electrically evoked contralateral saccades. The time course of eye position (horizontal, solid black lines; vertical, dashed gray lines) is shown after electrical microstimulation in the fastigial nucleus for 3 sites and as a function of the duration (A), frequency (B), and intensity (C) of stimulation. A: for site e18 [600 pulses/s (pps), 3T = 45 μA], when the stimulation was increased from 20 to 100 ms, the amplitude of the horizontal component increased from 2.7 ± 0.5 to 4.9 ± 0.3° and its peak velocity from 221 ± 34 to 286 ± 14°/s. The amplitude of the vertical component increased from 0.7 ± 0.5 to 1.1 ± 0.3° and its peak velocity from 65 ± 31 to 85 ± 17°/s. B: for site e16 (100 ms, 2T = 30 μA), when the stimulation frequency was increased from 400 to 600 pps, the amplitude of the horizontal component increased from 5.8 ± 2.1 to 10.4 ± 0.7° and its peak velocity from 233 ± 51 to 442 ± 30°/s. The amplitude of the vertical component decreased from 2.7 ± 1.7 to 2.5 ± 0.4°, whereas peak velocity increased from 117 ± 38 to 120 ± 13°/s. C: for site b54 (100 ms, 600 pps), when the current intensity was doubled from 40 to 80 μA (i.e., from 1T to 2T), the horizontal amplitude and peak velocity increased from 10.7 ± 3.4 to 16.8 ± 4.1° and from 334 ± 64 to 597 ± 66°/s, respectively, whereas the amplitude of the vertical component decreased from 4.5 ± 0.8 to 2.8 ± 1.4° and its peak velocity from 140 ± 23 to 138 ± 48°/s. The trajectory of saccades is illustrated at bottom. Values are means ± SD. Hor., horizontal; Vert., vertical.

