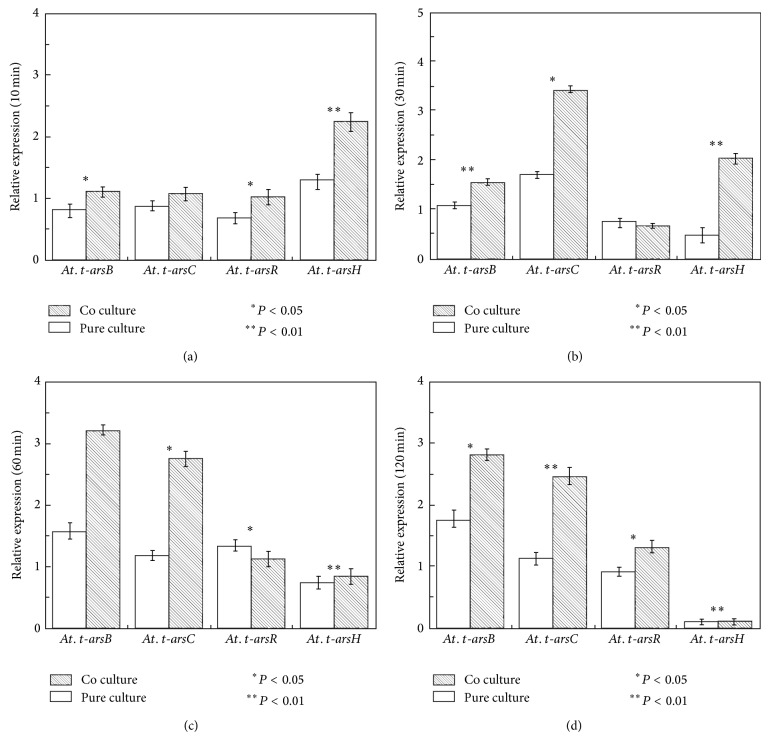
Figure 7.
Arsenic resistance gene expression of At. thiooxidans A01 in pure culture and coculture upon 300 mM As(III) shock at 10, 30, 60, and 120 minutes determined by real-time PCR: (a) 10 min; (b) 30 min; (c) 60 min; (d) 120 min. The error bars indicate the standard deviation in replicate samples (n = 3) and the P value indicates the statistical significance between pure and coculture (∗ P < 0.05; ∗∗ P < 0.01).

