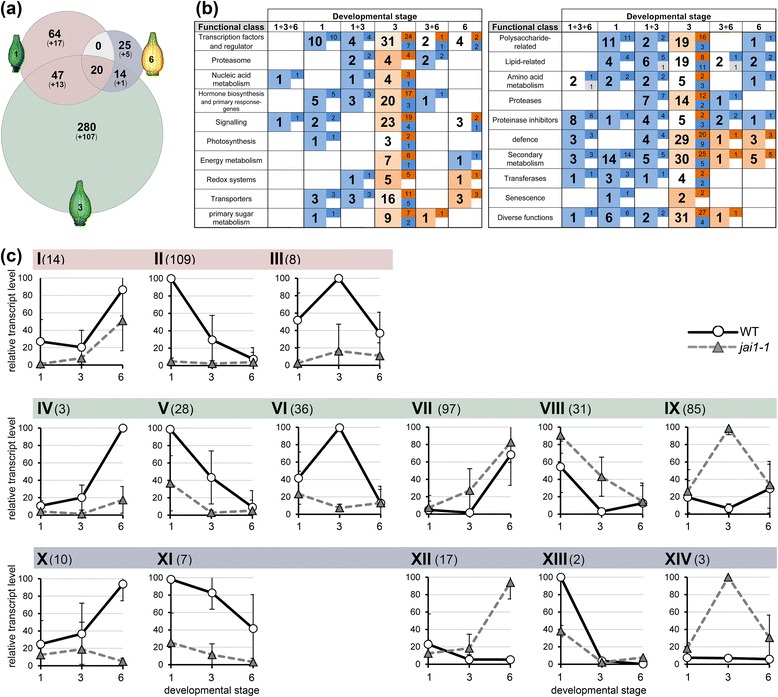
Figure 2.

Comparative analysis of transcript accumulation in stamens of wild type and jai1-1. Total RNA isolated from three developmental stages of stamens of wild type and jai1-1 was subjected to transcript profiling using the Agilent-Tomato 44 K-full genome chip. (a) Venn diagram showing the number of significantly regulated genes (P ≤0.01, n = 3). Numbers in parentheses are related to genes with unknown functions. Note that the highest number of differentially regulated genes was found in stage 3. (b) Classification of differentially expressed genes according to functional classes. The bold numbers indicate how many genes in total were differentially regulated in the respective developmental stage, whereas the regular numbers show how many of them exhibited increased transcript levels in wild type (dark red) or jai1-1 (dark blue). Light red and light blue colors mark the overall tendency of differential transcript accumulation in each developmental stage/functional class (red higher in wild type, blue higher in jai1-1). (c) Grouping of max-normalized differentially regulated genes according to their kinetics during development. The mean (± SD) of all genes belonging to the respective group is shown, for details of differentially expressed genes within the groups see Figure S1 in Additional file 2. Fourteen groups were generated by application of the following criteria: stage-specificity according to the Venn diagram (I-III: 1, 1 + 3, 1 + 3 + 6 (red), IV-IX: 3 (green), X-XIV: 3 + 6, 6 (blue)), higher expression levels in at least one developmental stage of wild type (I-VI, X-XI) or jai1-1 (VII-IX, XII-XIV), and kinetics of transcript levels (I, IV, VII, XII: increasing during development, II, V, VIII, XI, XIII: decreasing during development, III, VI, IX, XIV: peaking at stage 3). The Arabic numbers show the number of differentially regulated genes in each group.
