
Figure 4.
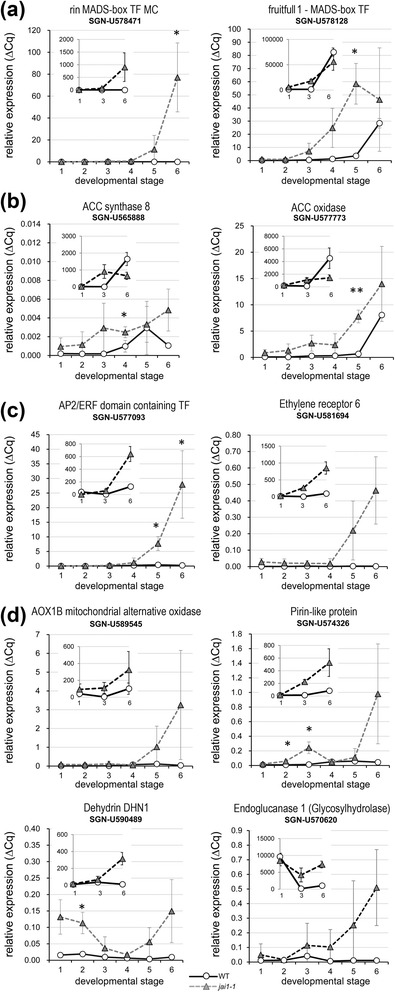
Transcript accumulation pattern of ethylene-related genes in developing stamens of wild type and jai1-1. Relative transcript levels of genes encoding ET-related TFs acting as ‘master regulators’ (a), ET biosynthetic enzymes (b), proteins involved in ET-signaling (c), and of ET-response genes (d). All transcript levels were determined by RT-qPCR and set in relation to SlTIP41. The inset in each diagram visualizes the signal intensity obtained from microarray analysis. Mean values ± SD are shown. Data of the same developmental stage were compared between wild type and jai1-1 by Student’s t-test (*P ≤0.05, **P ≤0.01, n = 3). ET, ethylene; SD, standard deviation.