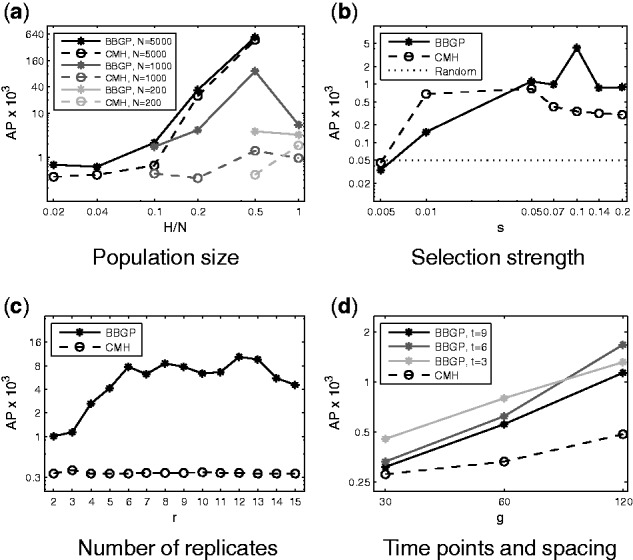
Fig. 6.

APs for different experimental designs. AP for random ranking is shown in (b) by a constant line at the true value of the ratio of selected SNPs in the simulated data, i.e. . Log scale was used on both axes for (a), (b), (d) and on the y-axis for (c). Other parameters are as in the basic setup in Section 2.7
