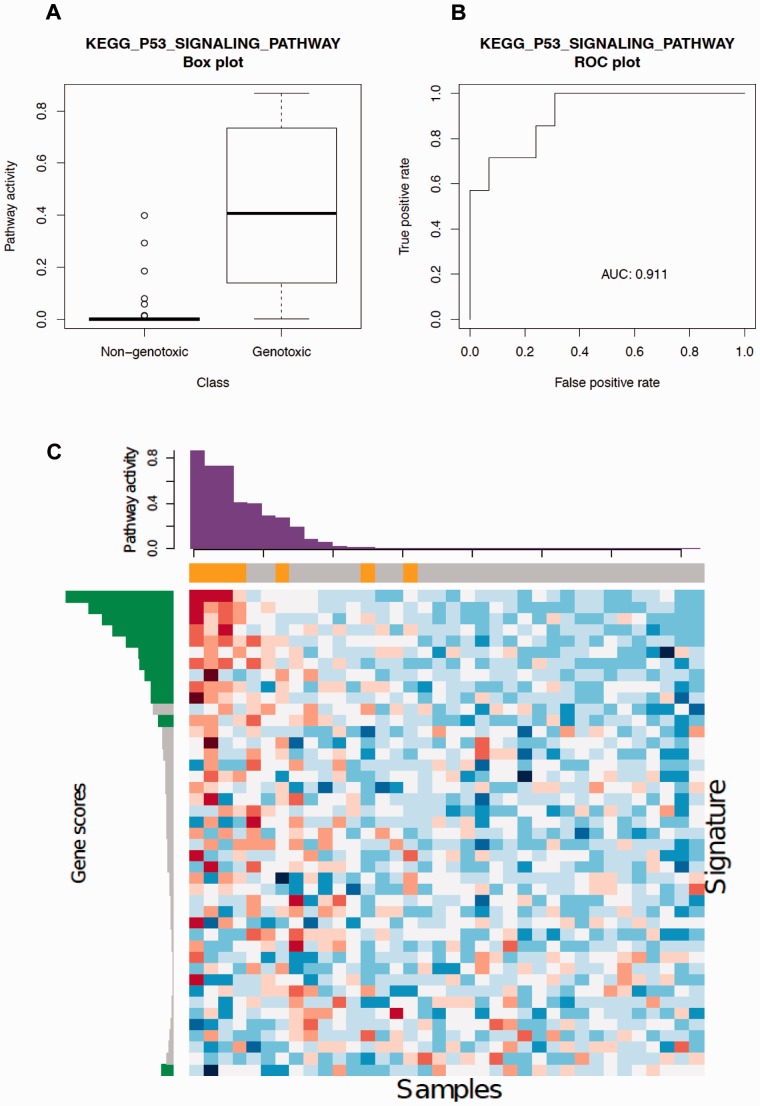
Fig. 4.
KEGG P53 signaling pathway signature in tissues exposed to carcinogens. (A) ASSIGN predicted pathway activity in rat liver tissues exposed to non-genotoxic or genotoxic carcinogens. The boxplot exhibits an association between genotoxic carcinogen exposure and P53 signaling pathway activation. (B) ROC curve for ASSIGN predicted signature strengths of the KEGG P53 signaling pathway. The corresponding area under the curve (AUC) is 0.911, suggesting an excellent model predictive ability. (C) Heatmap of 43 predefined P53 signaling pathway genes in 36 rat liver samples. Each row represents a gene and each column represents a sample. The color bar above the heatmap represents the treatment labels for each corresponding sample (orange: genotoxic; grey: non-genotoxic). The bar plot above the heatmap is the ASSIGN predicted signature strength for each corresponding sample. The bar plot on the left is the ASSIGN predicted posterior signature (green: gene included in the posterior signature; grey: gene not included)

