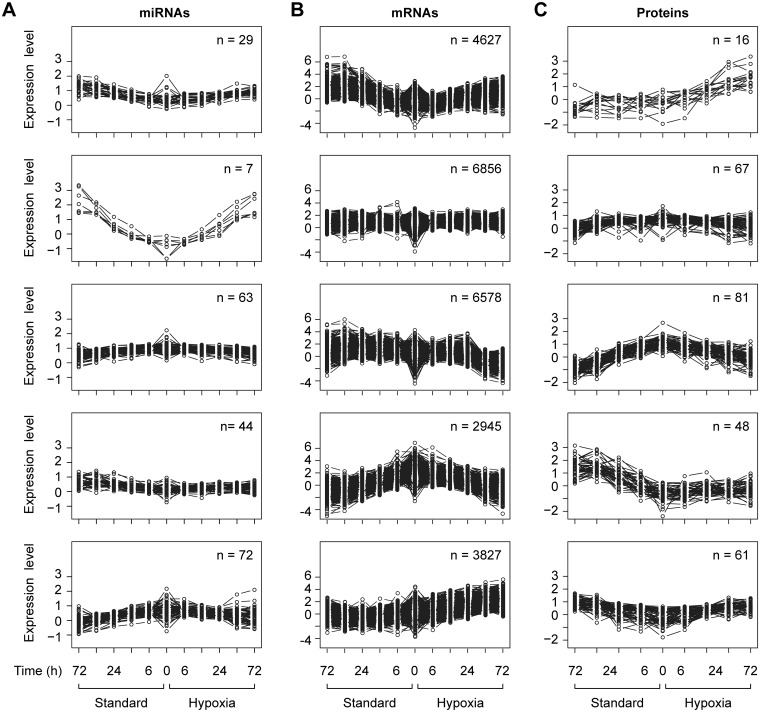
Fig. 2.
Plots of clusters of differentially expressed miRNAs/mRNAs/proteins. A miRNA/mRNA/protein is considered differentially expressed if its expression had changed during the time course under either the standard or hypoxic conditions. Expression values are averaged over the four placentas. Each plot represents a cluster of miRNAs/mRNAs/proteins obtained using k-means algorithm. The number of clusters were selected to cover interesting patterns of miRNA/mRNA/proteins expression, such as all members in a cluster were upregulated or downregulated in both conditions, or altered in one of the condition, and altered in the opposite direction in the other condition. Please note that some clusters did not follow any of these patterns. Also, note that there is no correlation among the three plots in the same row. They represent clustering of miRNAs, mRNAs and proteins, respectively

