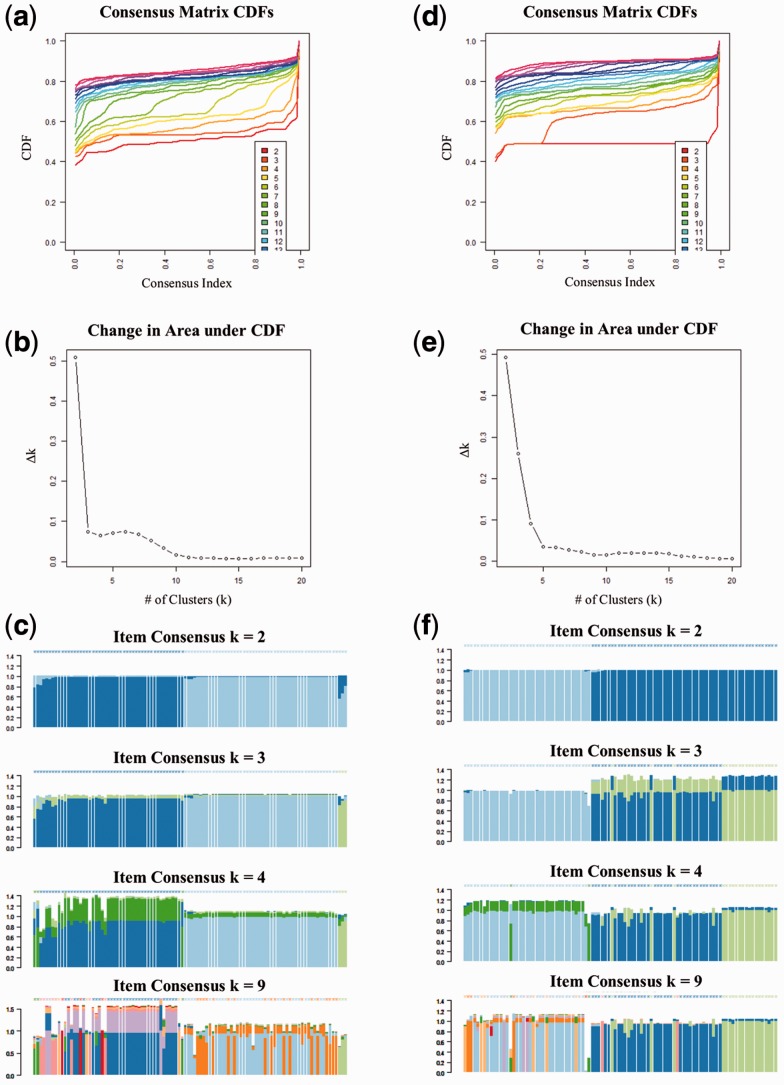
Fig. 5.
Measurements of consensus for different cluster sizes (k) from the consensus clustering analysis on the reanalyzed (a–c) and original counts (d–f) from the TCGA paired tumor-normal breast invasive carcinoma samples. The empirical cumulative distribution (CDF) plots (a) and (d) indicate at which k the shape of the curve approaches the ideal step function. Plots (b) and (e) depict the area under the two CDF curves. Item consensus plots (c) and (f) demonstrate the mean consensus of each sample with all other samples in a particular cluster (represented by color)

