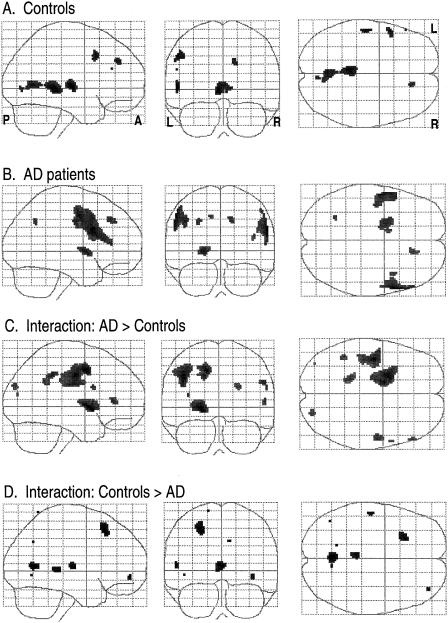
Fig. 4.
Activation patterns for the category-exemplar task. Maximum intensity projections in the three orthogonal views (sagittal, coronal, axial) of the brain depicting areas of activation foci, extent, and magnitude (higher amplitude of activation is darker) in group analyses. L = left, R = right, A = anterior, P = posterior. Rows A and B represent the simple effects (task vs. rest) for the control group and AD group respectively. Rows C and D depict the interaction between groups where amplitude of activation is greater in AD than controls (Row C), and where amplitude of activation in controls is greater than AD (Row D).

