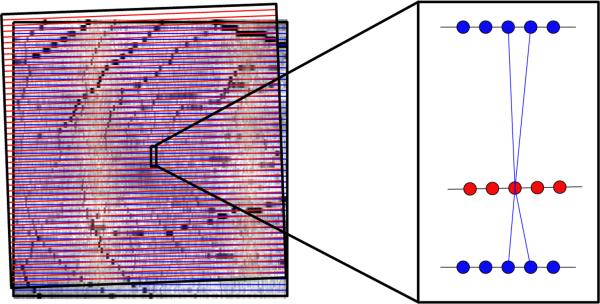
Figure 3.
On the left are the outlines of two fundus images after alignment, with B-scan locations represented by horizontal lines. After registration, the vertices no longer have direct correspondences for connecting the graphs. Therefore, we connect vertices at one visit (red) to the four nearest vertices in the next visit (blue). The weighting of each edge is inversely proportional to the distance, encouraging the final segmentation to look more similar to closer vertices.

