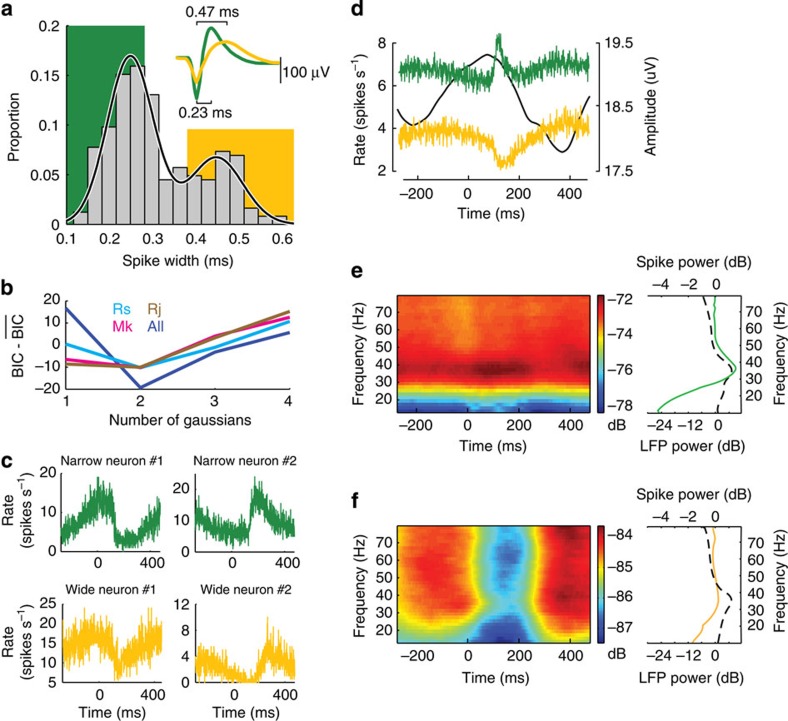
Figure 2. Two functional cell classes based on extracellular spike waveform width.
(a) Histograms of spike waveform widths for all three monkeys, Rs, Mk and Rj. The solid curve indicates the fit using mixture of two Gaussians. Background colour indicates the bins classified as narrow (green) and wide (yellow) units. Inset: Examples of motor cortical units with narrow (green) and wide (yellow) spike waveform widths. (b) The difference between BIC values minus the mean BIC values over the range as a function of the number of Gaussians used in the mixture model to fit the distributions of spike widths. (c) Example peri-stimulus time histograms from two narrow (green) and two wide (yellow) spiking neurons from monkey Mk. (d) Averaged population spike rates for the two classes of cells from monkey Mk, narrow class in green and wide class in yellow. The time-resolved beta oscillation amplitude is plotted as a solid black line. (e,f) Averaged spectrograms for the two classes of units from monkey Mk, narrow class (e, left) and wide class (f, left), and averaged power spectra for the each class of units, narrow class in green (e, right) and wide class in yellow (f, right) computed over [−100, 300] ms relative to the visual target onset. Black dashed line on the right subfigures denotes average LFP spectrum over all channels with the base line pink noise removed.

