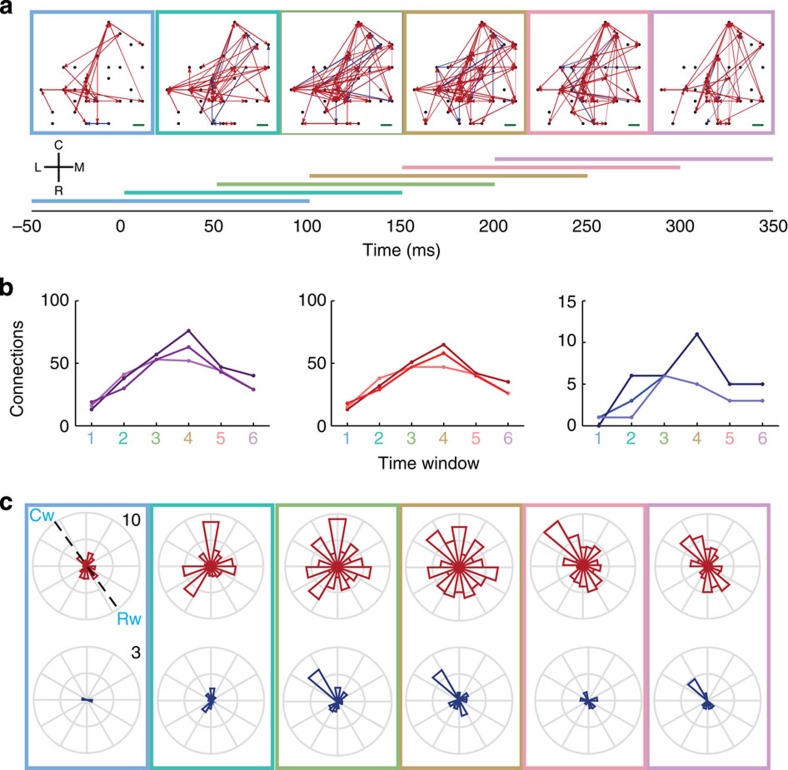
Figure 3. Spatiotemporal patterns of network connectivity of narrow class of neurons in MI in six 150 ms time windows incremented by 50 ms from monkey Rs data set.
(a) Networks of significant directed connections on the array at different time windows (in milliseconds) in relation to the onset of visual target appearance. Each horizontal colour bar indicates duration of a time window used to compute a network surrounded by the same colour. C, R, M and L indicate caudal, rostral, medial and lateral orientations, respectively, on the cortical surface. Red and blue arrows represent excitatory and inhibitory connections, respectively. The black dots represent the relative positions of the electrodes on the array where the neurons were detected. Neurons whose spikes rates are ⩾1 spike s−1 and with narrow spike widths (≤0.267 ms) were analysed. The green scale bar on the right-bottom equals 400 μm on the cortical surface. (b) Number of significant connections at different time windows for both excitatory and inhibitory connections (left), excitatory connections only (center) and inhibitory connections only (right). The lines in different colour shades correspond to different time windows of data in the recording session. (c) Circular distribution of directed excitatory connections weighted by their strength and normalized by the total number of possible connections in each orientation on the surface of MI at the different time windows (top). Circular distribution of directed inhibitory connections weighted by their strength and normalized by the total number of possible connections in each orientation on the surface of MI at the different time windows (bottom). All rose plots are oriented in the same way as in the anatomical coordinate system defined with C, caudal; R, rostral; M, medial and L, lateral in a. A dashed line in the top left rose plot connecting Cw (caudal wave direction) and Rw (rostral wave direction) defines the wave propagation axis as in Fig. 1d.

