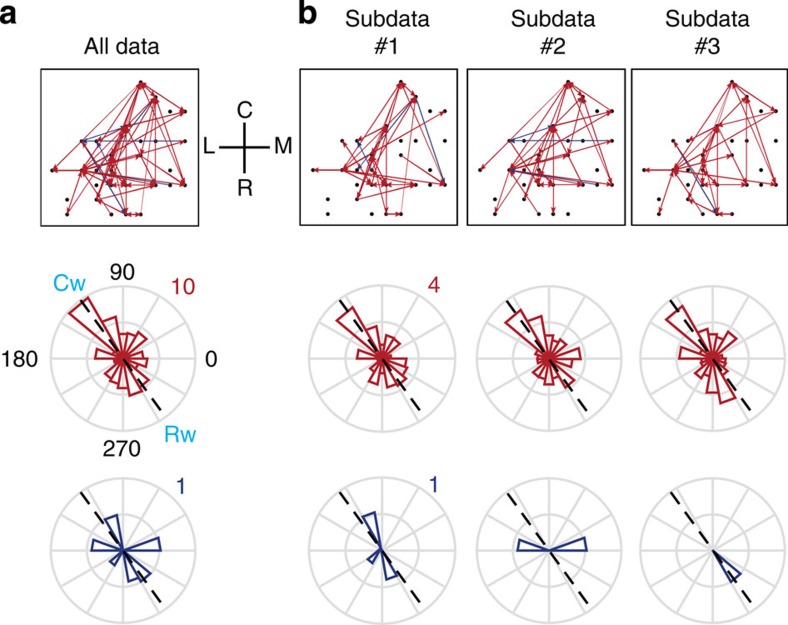
Figure 5. Consistency in spatial patterning of network connectivity across different subsets of data in time window 5 within the data set in monkey Rs.
Networks of significant connections (top), circular distributions of excitatory connections (middle) and circular distributions of inhibitory connections (bottom). (a) Results from all three subsets of data were pooled. (b) Results from each subset of data are illustrated in each column. All plots are oriented by the coordinate system defined by C, caudal; R, rostral; M, medial and L, lateral in a. A dashed line in each rose plot connecting Cw (caudal wave direction) and Rw (rostral wave direction) defines the wave propagation axis as in Fig. 1d.

