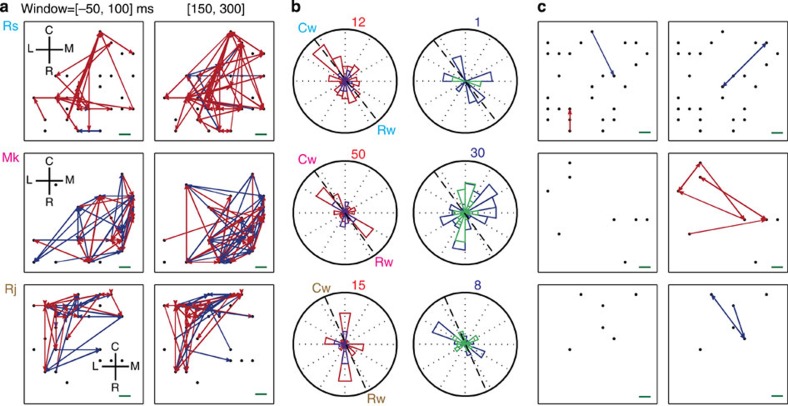
Figure 6. Spatiotemporal patterns of network connectivity of narrow and wide classes of neurons in two time windows.
Data from monkeys Rs (top), Mk (middle) and Rj (bottom). (a) Networks of significant directed connections on the array at different time windows. Red and blue arrows represent excitatory and inhibitory connections, respectively. The black dots represent the relative positions of the electrodes on the array where the neurons were detected. If >1 neuron was detected on a given electrode, a given dot contains all units on that electrode. Neurons with firing rates ⩾1 spike s−1 and narrow spike widths (≤∼0.2667, ms) in MI were analysed. The green scale bar on the right-bottom equals 400 μm on the cortical surface. R, rostral; C, caudal; M, medial and L, lateral denote the anatomical orientation. (b) Circular distributions of directed excitatory (left) and inhibitory (right) connections weighted by their strength and normalized by the total number of possible connections. The circular distribution of excitatory connections for time window [−50, 100] ms in purple overlies that for time window [150, 300] ms in red. The circular distributions of inhibitory connections for the same windows are in teal and blue, respectively. The dashed black lines represent the beta wave axis. (c) Same as in a, but using neurons with firing rates ⩾1 spike s−1 and wide spike widths (⩾0.4000, ms).

