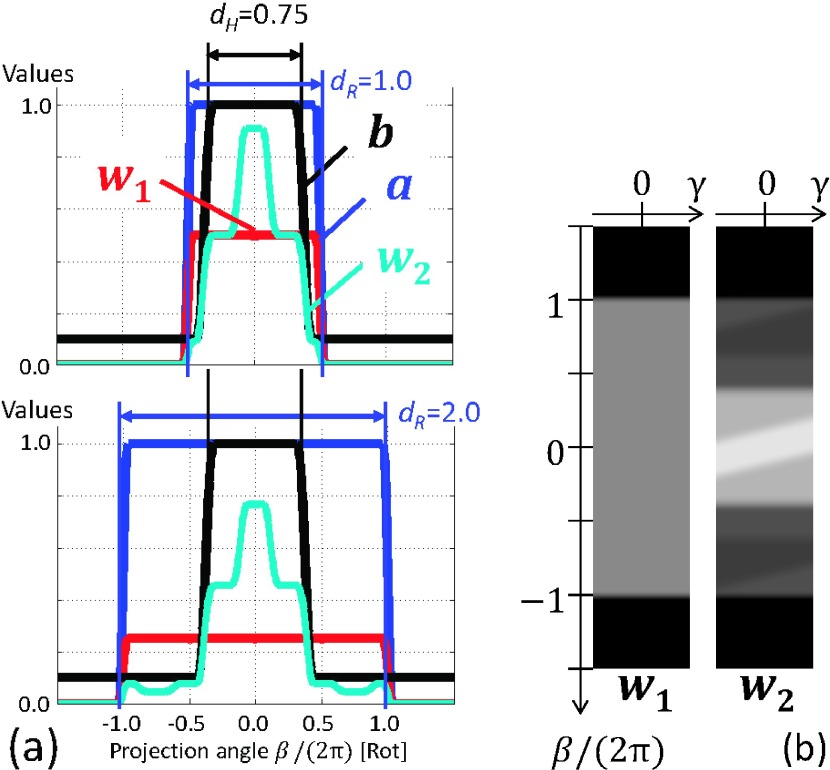
FIG. 4.
(a) Profiles of the functions a and b and weights w1 and w2 for γ = 0 with two different dR (top, dR = 1.0 rot; bottom, dR = 2.0 rot) when IL/IH = 0.1 and dH = 0.75 rot. (b) Gray scale displays of w1 and w2 when IL/IH = 0.1, dH = 0.75 rot, and dR = 2.0 rot. Window width and level are 0.8 and 0.4, respectively.

