FIG. 6.

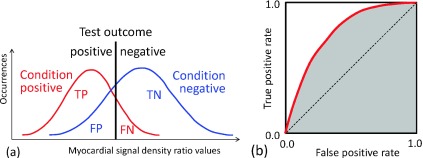
The concept of a binary classification test. (a) The test outcomes are positive when myocardial signal density ratios are lower than a given threshold (black line); the test outcomes are negative when higher. Comparing the test outcomes with actual conditions, there are four possible results from a binary classifier: a true positive (TP), a false positive (FP), a true negative (TN), and a false negative (FN). (b) The test is repeated by sweeping the threshold value from low to high and calculating the true positive rate and the false positive rate for each threshold value. The ROC-curve is obtained by plotting true positive rates against false positive rates. The AUC value was the shaded area.
